All Instances Heatmap

View current alert status and performance metrics of all or just one of your IBM DB2 instances. Use the Metric drop-down menu to view Alert Severity, Alert Count, Response Time, I/O Wait Time %, Network Wait Time %, Agent Wait Time %, Avg Deadlocks per Activity, Avg Lock Escalations per Activity, Avg Lock Timeouts per Activity, Avg Lock Waits per Activity, Rows Read per Rows Returned, Activites/sec, App Requests/sec, App Commits/sec, App Rollbacks/sec or Buffer Pool Hit Ratio %.

Answer questions such as, Are any instances reaching a state of critical health? Do I need to allocate more tablespace to an instance? Are response times slow on any instances? Are application deadlocks causing bottlenecks on any instances? Is processing load evenly distributed across instances?

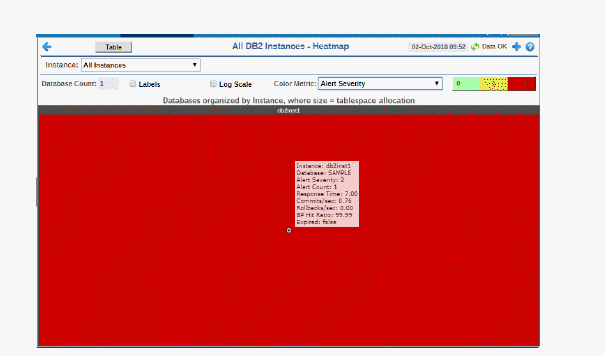
Each rectangle in the heatmap represents a different instance, where the rectangle color indicates the most critical alert state for items associated with that instance, and the rectangle size represents the tablespace allocation size for the instance.

Each metric has its own color gradient bar legend that maps values to colors. By default, the Alert Severity metric is shown, which is the current alert severity for items associated with the rectangle. Values range from 0 - 2, as indicated in the color gradient color_gradient_sever.gif bar:

red_indicator_light.gif (2) Red indicates that one or more metrics exceeded their ALARM LEVEL threshold.

yellow_indicator_light.gif (1) Yellow indicates that one or more metrics exceeded their WARNING LEVEL threshold.

green_indicator_light.gif (0) Green indicates that no metrics have exceeded their alert thresholds.

Other performance metrics include wait times, application requests and rollbacks.

Use the Labels check-box checkbox.gif to include or exclude labels in the heatmap, use the Log Scale check-box checkbox00001.gif to apply log scale and mouse over a rectangle to see additional metrics. Click a rectangle to drill down on an instance in the Instance Summary display.
db2_instnce_heat.gif

title_bar_shortNew.gif


Fields and Data:


Instance:

Select an instance.


Labels

Select this check box to display the names of the instances at the top of each rectangle in the heatmap.


Log Scale

Select this check box to enable a logarithmic scale. Use Log Scale to see usage correlations for data with a wide range of values. For example, if a minority of your data is on a scale of tens, and a majority of your data is on a scale of thousands, the minority of your data is typically not visible in non-log scale graphs. Log Scale makes data on both scales visible by applying logarithmic values rather than actual values to the data.


Metric

Choose a metric to view in the display. For details about the data, refer to vendor documentation.


Alert Severity

The current alert severity for items associated with the rectangle. Values range from 0 - 2, as indicated in the color gradient color_gradient_sever00002.gif bar, where 2 is the highest Alert Severity:

red_indicator_light00003.gif (2) Red indicates that one or more metrics exceeded their ALARM LEVEL threshold.

yellow_indicator_light00004.gif (1) Yellow indicates that one or more metrics exceeded their WARNING LEVEL threshold.

green_indicator_light00005.gif (0) Green indicates that no metrics have exceeded their alert thresholds.


Alert Count

The total number of critical and warning unacknowledged alerts for items associated with the rectangle. The color gradient color_gradient_count.gif bar, populated by the current heatmap, shows the value/color mapping. The numerical values in the gradient bar range from 0 to the maximum count of alerts in the heatmap. The middle value in the gradient bar indicates the middle value of the range.


Response Time

The average response time, in milliseconds, for items associated with the rectangle. The color gradient bar allservers40bar.gif shows the range of the value/color mapping. By default, the numerical values in the gradient bar range from 0 to the alert threshold of the Db2ResponseTimeHigh alert. The middle value in the gradient bar indicates the middle value of the range.

red_indicator_light00006.gif Red indicates that one or more metrics exceeded their ALARM LEVEL threshold.

yellow_indicator_light00007.gif Yellow indicates that one or more metrics exceeded their WARNING LEVEL threshold.

green_indicator_light00008.gif Green indicates that no metrics have exceeded their alert thresholds.


I/O Wait Time %

The percentage of the wait time being used by I/O processes. The color gradient bar allservers40bar00009.gif shows the range of the value/color mapping. By default, the numerical values in the gradient bar range from 0% to 100% of the Db2ResponseTimeHigh alert threshold. The middle value in the gradient bar indicates the middle value of the range.

red_indicator_light00010.gif Red indicates that one or more metrics exceeded their ALARM LEVEL threshold.

yellow_indicator_light00011.gif Yellow indicates that one or more metrics exceeded their WARNING LEVEL threshold.

green_indicator_light00012.gif Green indicates that no metrics have exceeded their alert thresholds.

The percentage wait time taken by I/O operations.


Network Wait Time %

The percentage of the wait time being used by network processes. The color gradient bar allservers40bar00013.gif shows the range of the value/color mapping. By default, the numerical values in the gradient bar range from 0% to 100% of the Db2ResponseTimeHigh alert threshold. The middle value in the gradient bar indicates the middle value of the range.

red_indicator_light00014.gif Red indicates that one or more metrics exceeded their ALARM LEVEL threshold.

yellow_indicator_light00015.gif Yellow indicates that one or more metrics exceeded their WARNING LEVEL threshold.

green_indicator_light00016.gif Green indicates that no metrics have exceeded their alert thresholds.


Agent Wait Time %

The percentage of the wait time being used by agent processes. The color gradient bar allservers40bar00017.gif shows the range of the value/color mapping. By default, the numerical values in the gradient bar range from 0% to 100% of the Db2ResponseTimeHigh alert threshold. The middle value in the gradient bar indicates the middle value of the range.

red_indicator_light00018.gif Red indicates that one or more metrics exceeded their ALARM LEVEL threshold.

yellow_indicator_light00019.gif Yellow indicates that one or more metrics exceeded their WARNING LEVEL threshold.

green_indicator_light00020.gif Green indicates that no metrics have exceeded their alert thresholds.


Avg Deadlocks per Activity

The average number of application deadlocks per activity. The color gradient bar allservers40bar00021.gif shows the range of the value/color mapping. By default, the numerical values in the gradient bar range from 0 to the alert threshold of the Db2DeadlockRateHigh alert. The middle value in the gradient bar indicates the middle value of the range.

red_indicator_light00022.gif Red indicates that one or more metrics exceeded their ALARM LEVEL threshold.

yellow_indicator_light00023.gif Yellow indicates that one or more metrics exceeded their WARNING LEVEL threshold.

green_indicator_light00024.gif Green indicates that no metrics have exceeded their alert thresholds.


Avg Lock Escalations per Activity

The average number of application deadlocks that were escalated per activity. The color gradient bar allservers40bar00025.gif shows the range of the value/color mapping. By default, the numerical values in the gradient bar range from 0 to the alert threshold of the Db2DeadlockRateHigh alert. The middle value in the gradient bar indicates the middle value of the range.

red_indicator_light00026.gif Red indicates that one or more metrics exceeded their ALARM LEVEL threshold.

yellow_indicator_light00027.gif Yellow indicates that one or more metrics exceeded their WARNING LEVEL threshold.

green_indicator_light00028.gif Green indicates that no metrics have exceeded their alert thresholds.


Avg Lock Timeouts per Activity

The average number of application lock timeouts per activity. The color gradient bar allservers40bar00029.gif shows the range of the value/color mapping. By default, the numerical values in the gradient bar range from 0 to the alert threshold of the Db2LockWaitTimeHigh alert. The middle value in the gradient bar indicates the middle value of the range.

red_indicator_light00030.gif Red indicates that one or more metrics exceeded their ALARM LEVEL threshold.

yellow_indicator_light00031.gif Yellow indicates that one or more metrics exceeded their WARNING LEVEL threshold.

green_indicator_light00032.gif Green indicates that no metrics have exceeded their alert thresholds.


Avg Lock Waits per Activity

The average number of application lock waits per activity. The color gradient bar allservers40bar00033.gif shows the range of the value/color mapping. By default, the numerical values in the gradient bar range from 0 to the alert threshold of the Db2LockWaitTimeHigh alert. The middle value in the gradient bar indicates the middle value of the range.

red_indicator_light00034.gif Red indicates that one or more metrics exceeded their ALARM LEVEL threshold.

yellow_indicator_light00035.gif Yellow indicates that one or more metrics exceeded their WARNING LEVEL threshold.

green_indicator_light00036.gif Green indicates that no metrics have exceeded their alert thresholds.The average number of application deadlock timeouts per activity.


Rows Read per Rows Returned

The total number of rows read per number of rows returned. The color gradient color_gradient.gif bar, populated by the current heatmap, shows the value/color mapping. The numerical values in the gradient bar range from 0 to the maximum value in the heatmap. The middle value in the gradient bar indicates the middle value of the range.


Activites/sec

The rate of activities (per second). The color gradient color_gradient00037.gif bar, populated by the current heatmap, shows the value/color mapping. The numerical values in the gradient bar range from 0 to the maximum number of incoming messages per second. The middle value in the gradient bar indicates the middle value of the range.


App Requests/sec

The rate of application requests (per second). The color gradient color_gradient00038.gif bar, populated by the current heatmap, shows the value/color mapping. The numerical values in the gradient bar range from 0 to the maximum number of incoming messages per second. The middle value in the gradient bar indicates the middle value of the range.


App Commits/sec

The rate of application commits (per second). The color gradient color_gradient00039.gif bar, populated by the current heatmap, shows the value/color mapping. The numerical values in the gradient bar range from 0 to the maximum number of incoming messages per second. The middle value in the gradient bar indicates the middle value of the range.


App Rollbacks/sec

The rate of application rollbacks (per second). The color gradient color_gradient00040.gif bar, populated by the current heatmap, shows the value/color mapping. The numerical values in the gradient bar range from 0 to the maximum number of incoming messages per second. The middle value in the gradient bar indicates the middle value of the range.


Buffer Pool Hit Ratio %

The percentage Tablespace used by the buffer pool hit ratio, which is the total number of pool hits divided by the total number of buffer pool lookups. The color gradient bar allservers40bar00041.gif shows the range of the value/color mapping. By default, the numerical values in the gradient bar range from 0% to 100% of the Db2UsedTablespaceHig alert threshold. The middle value in the gradient bar indicates the middle value of the range.

red_indicator_light00042.gif Red indicates that one or more metrics exceeded their ALARM LEVEL threshold.

yellow_indicator_light00043.gif Yellow indicates that one or more metrics exceeded their WARNING LEVEL threshold.

green_indicator_light00044.gif Green indicates that no metrics have exceeded their alert thresholds.