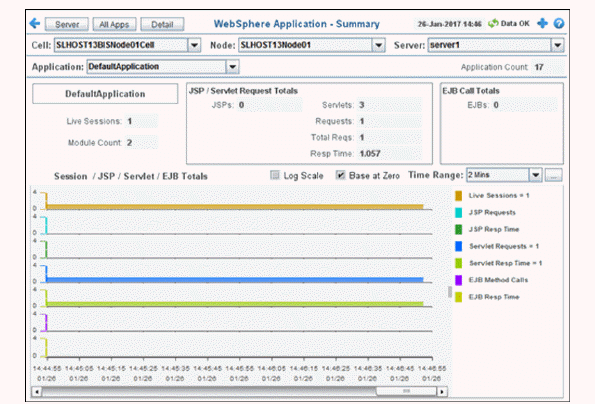
View performance metrics for a web application on one server. Choose a cell, node, server and application from the drop-down menus.
|
Filter By: |
|||
|
|
Cell: |
Choose the cell for which you want to show data. |
|
|
|
Node: |
Choose the node for which you want to show data. |
|
|
|
Server: |
Choose the server for which you want to show data. |
|
|
|
Application: |
Choose the application for which you want to show data. |
|
|
Fields and Data This display includes: |
|
||
|
|
Application Count |
The number of applications in the display. |
|
|
|
Live Sessions |
The current number of active sessions. |
|
|
|
Module Count |
The current number of modules. |
|
|
|
JSP/Servlet Request Totals |
||
|
|
|
JSPs |
The current number of JSP requests. |
|
|
|
Servlets |
The current number of servlet requests. |
|
|
EJB Call Totals |
||
|
|
|
EJBs |
The current number of EJB (Enterprise JavaBean) requests. |
|
Session/JSP/Servlet/EJB Totals Trend Graph
|
|||
|
|
Log Scale |
Select to enable a logarithmic scale. Use Log Scale to see usage correlations for data with a wide range of values. For example, if a minority of your data is on a scale of tens, and a majority of your data is on a scale of thousands, the minority of your data is typically not visible in non-log scale graphs. Log Scale makes data on both scales visible by applying logarithmic values rather than actual values to the data. |
|
|
|
Base at Zero |
Use zero as the Y axis minimum for all graph traces. |
|
|
|
Time Range |
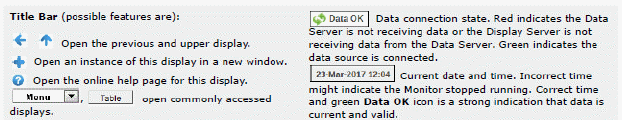
Select a time range from the drop down menu varying from 2 Minutes to Last 7 Days, or display All Data. To specify a time range, click Calendar 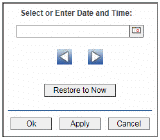
By default, the time range end point is the current time. To change the time range end point, click Calendar Use the navigation arrows Click Restore to Now to reset the time range end point to the current time.
|
|
 .
.  and select a date and time from the calendar or enter the date and time in the text field using the following format:
  to move forward or backward one time period. NOTE: The time period is determined by your selection from the