 to specify your own.
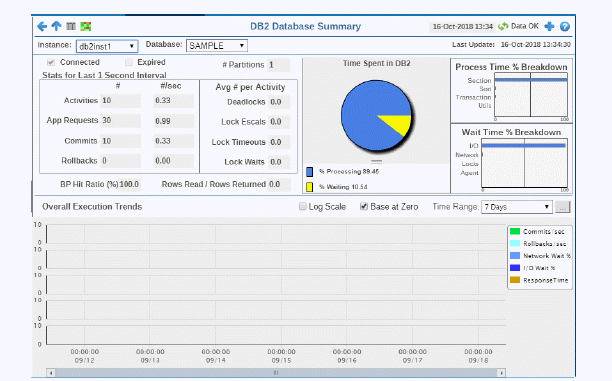
Use this display to investigate the performance and health of a database.
Select an Instance and a Database. Check main performance statistics such as database load, Commits per second, Processing Time Breakdown and Wait Time Breakdown
View trend graphs tracing Commits and Rollbacks per second, Wait and Response times, among others.
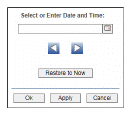
Choose a Time Range or click  to specify your own.


|
Instance: |
Choose an instance. |
|||
|
Database: |
Choose a database. |
|||
|
|
Connected |
When checked, the database is connected. |
||
|
|
Expired |
When checked, performance data has not been received within the time specified by your administrator for the Expire Time. If your administrator has also set the Delete Time, this row will be deleted if no data is received within the time specified for deletion. |
||
|
|
# Partitions |
The number of partitions on the database. |
||
|
Stats for Last 1 Second Interval |
||||
|
|
|
# |
#/sec |
|
|
|
Activites |
Total number of activities in the last 1 second. |
Value per second. |
|
|
|
App Requests |
Total number of application requests in the last 1 second. |
Value per second. |
|
|
|
Commits |
Total number of commits in the last 1 second. |
Value per second. |
|
|
|
Rollbacks |
Total number of rollbacks in the last 1 second. |
Value per second. |
|
|
Avg # per Activity |
||||
|
|
Deadlocks |
The average number of deadlocks per activity in the last 1 second. |
||
|
|
Lock Escal |
The average number of lock escalations per activity in the last 1 second. |
||
|
|
Lock Timeouts |
The average number of lock timeouts per activity in the last 1 second. |
||
|
|
Lock Waits |
The average number of lock waits per activity in the last 1 second. |
||
|
Time Spent in DB2 |
||||
|
|
% Processing |
|
|
|
|
|
% Waiting |
|
|
|
|
Process Time % Breakdown |
Shows the percentage of total processing time for the instance used by the following types of actions:
|
|||
|
Wait Time % Breakdown |
Shows the percentage of total wait time used for the instance categorized by:
|
|||
|
|
BP Hit Ratio % |
The current buffer pool hit ratio, which is the total number of pool hits divided by the total number of buffer pool lookups. |
||
|
|
Rows Read / Rows Returned |
The number of rows read per number of rows returned. |
||
|
Overall ExecutionTrends For the selected datbase, trend graphs trace as follows:
|
||||
|
|
Log Scale |
Select to enable a logarithmic scale. Use Log Scale to see usage correlations for data with a wide range of values. For example, if a minority of your data is on a scale of tens, and a majority of your data is on a scale of thousands, the minority of your data is typically not visible in non-log scale graphs. Log Scale makes data on both scales visible by applying logarithmic values rather than actual values to the data.
|
||
|
|
Base at Zero |
Select to use zero (0) as the Y axis minimum for all graph traces. |
||
|
|
Time Range |
Select a time range from the drop down menu varying from 2 Minutes to Last 7 Days, or display All Data. By default, the time range end point is the current time. To enter a specific time range, click the associated ellipsis button 
To change the time range click the Open Calendar button
|
||