 to specify your own. Mouse-over to see additional details..
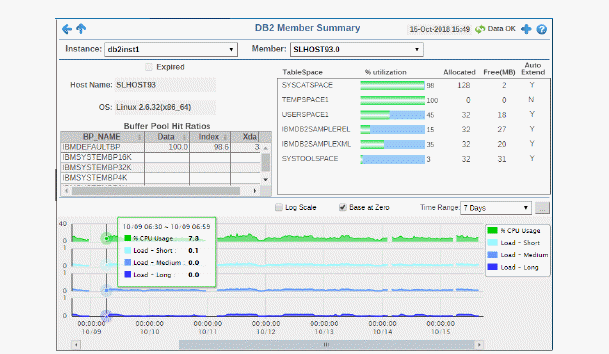
Use this display to study trends for a single host member, such as CPU usage and loads (Short, Medium and Long).
Select an Instance and a Member from the drop-down menus. Check status of the selected host member TableSpace allocations and current Buffer Pool Hit Ratios.
Choose a Time Range or click to specify your own. Mouse-over to see additional details..
|
Instance: |
Choose an instance. |
|||
|
Member: |
Choose a member. |
|||
|
|
Expired |
When checked, performance data has not been received within the time specified by your administrator for the Expire Time. If your administrator has also set the Delete Time, this row will be deleted if no data is received within the time specified for deletion. |
||
|
|
Host Name |
The name of the selected host member. |
||
|
|
OS |
The operating system on the selected host member. |
||
|
|
Buffer Pool Hit Ratios Each row in the table in a different buffer pool. Values describe values for the selected host member. |
|||
|
|
|
BP_NAME |
The name of the buffer pool. |
|
|
|
|
Data |
|
|
|
|
|
Index |
|
|
|
|
|
Xda |
|
|
|
|
TableSpace Values describe TableSpace values for the selected host member. |
|||
|
|
|
TableSpace |
The name of the TableSpace. |
|
|
|
|
% Utilization |
The percentage of TableSpace used. |
|
|
|
|
Allocated |
The amount of TableSpace allocated. |
|
|
|
|
Free(MB) |
The amount of free TableSpace, in megabytes. |
|
|
|
|
Auto Extend |
Indicates whether auto extend is enabled. Y/N |
|
|
Trend Graph For the selected host member, trend graphs trace as follows:
|
||||
|
|
Log Scale |
Select to enable a logarithmic scale. Use Log Scale to see usage correlations for data with a wide range of values. For example, if a minority of your data is on a scale of tens, and a majority of your data is on a scale of thousands, the minority of your data is typically not visible in non-log scale graphs. Log Scale makes data on both scales visible by applying logarithmic values rather than actual values to the data.
|
||
|
|
Base at Zero |
Select to use zero (0) as the Y axis minimum for all graph traces. |
||
|
|
Time Range |
Select a time range from the drop down menu varying from 2 Minutes to Last 7 Days, or display All Data. By default, the time range end point is the current time. To enter a specific time range, click the associated ellipsis button 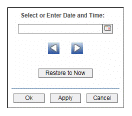
To change the time range click the Open Calendar button
|
||


