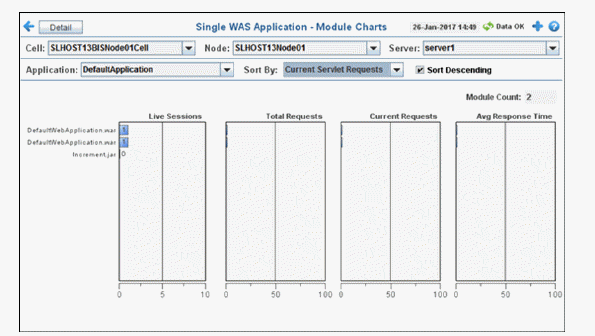
View performance metrics for a WAS application on one server. Choose a cell, node, server and application from the drop-down menus.


|
Filter By: |
|||
|
|
Cell: |
Choose the cell for which you want to show data. |
|
|
|
Node: |
Choose the node for which you want to show data. |
|
|
|
Server: |
Choose the server for which you want to show data. |
|
|
|
Application: |
Choose the application for which you want to show data. |
|
|
|
Sort By: |
|
|
|
Fields and Data: |
|||
|
|
Sort Descending |
Select to organize display elements in descending order. |
|
|
|
Module Count |
The number of modules in the display. |
|
|
Graphs Refer to vendor documentation for details. |
|||
|
|
Live Sessions Graph |
Shows performance metrics for current sessions. |
|
|
|
Total Requests Graph |
Shows performance metrics for total requests. |
|
|
|
Current Requests Graph |
Shows performance metrics for current requests. |
|
|
|
Avg Response Time Graph |
Shows performance metrics for average response time. |
|