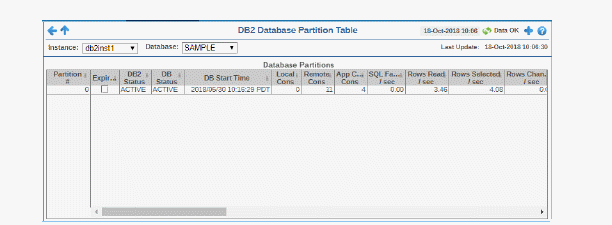
View a list of all partitions on a database, performance metrics for each partition, as well as setup details such as the product associated with the partition and service level.
Use this display to investigate partitioning issues on a database. Select an Instance and a Database. Sort the list by column values such as DB2 Status, Rollbacks per second and many others.


|
Database Partitions Table Each row is a different partition on the selected database. Column values describe the partition. |
||||
|
Instance: |
Select an instance. |
|||
|
Database: |
Select a database. |
|||
|
|
Partition # |
The partition number. |
||
|
|
Expired |
When checked, performance data has not been received within the time specified by your administrator for the Expire Time. If your administrator has also set the Delete Time, this row will be deleted if no data is received within the time specified for deletion. |
||
|
|
DB2 Status |
The current DB2 status. For example, ACTIVE. |
||
|
|
DB Status |
The current database status. For example, ACTIVE. |
||
|
|
DB Start Time |
The date and time the database was last started. |
||
|
|
Local Cons |
The number of local connections. |
||
|
|
Remote Cons |
The number of remote connections. |
||
|
|
App Cur Cons |
The number of currently connected applications. |
||
|
|
SQL Faults/sec |
The number of SQL faults per second. |
||
|
|
Rows Read /sec |
The number of rows read per second. |
||
|
|
Rows Selected /sec |
The number of rows selected per second. |
||
|
|
Rows Changed /sec |
The number of rows changed per second. |
||
|
|
SQL Selects /sec |
The number of SQL selects per second. |
||
|
|
Commits /sec |
The number of commits per second. |
||
|
|
Rollbacks /sec |
The number of rollbacks per second. |
||
|
|
Update/Del/Ins/Stmts /sec |
The number of updates, deletions, insertions and statements per second. |
||
|
|
Avg Sort Time/Transaction |
The average amount of time for sorting transactions. |
||
|
|
Product Name |
The name of the product. |
||
|
|
Service Level |
The service level for the product. |
||
|
|
Pool Data Hit Ratio |
The current buffer pool hit ratio, which is the total number of pool hits divided by the total number of buffer pool lookups. |
||
|
|
Pool TmpData Hit Ratio |
Refer to vendor documentation for details. |
||
|
|
Pool TmpIndex Hit Ratio |
Refer to vendor documentation for details. |
||
|
|
Pkg Cache Inserts/K-Trans |
Refer to vendor documentation for details. |
||
|
|
Lock Wait Time/K-Trans |
Refer to vendor documentation for details. |
||
|
|
Dirty Steal Triggers/K-Trans |
Refer to vendor documentation for details. |
||
|
|
Deadlocks & Lock Timeouts/K-Tran |
Refer to vendor documentation for details. |
||
|
|
Avg Log Write Time / Trans |
Refer to vendor documentation for details. |
||
|
|
% Agent Usage |
The percentage used by agents. |
||
|
|
Agents Registered (Top) |
The number of registered agents. |
||
|
|
Rows Read Returned Ratio |
The number of rows read per number of rows returned. |
||
|
|
Select % |
Refer to vendor documentation for details. |
||
|
|
Phys Buffer Pool Read Ratio |
Refer to vendor documentation for details. |
||
|
|
Phys Buffer Pool Write Ratio |
Refer to vendor documentation for details. |
||