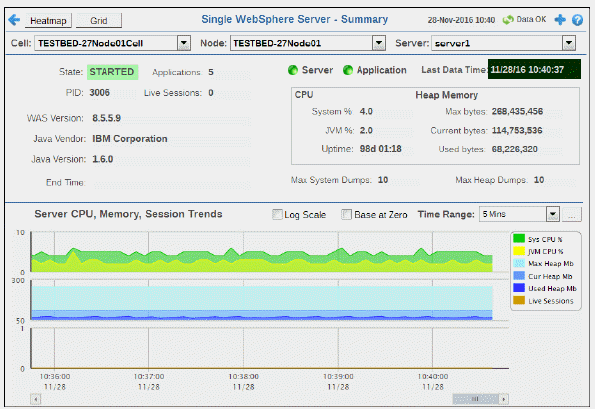
Track current and historical performance of web applications on one server. Choose a cell, node and server from the drop-down menus. Mouse over the trend graph to see metrics.


|
Filter By: |
|
|
|
|
|
Cell: |
Choose a cell or All Cells to see metrics for. |
|
|
|
Node: |
Choose a node or All Nodes to see metrics for. |
|
|
|
Server: |
Choose the server for which you want to show data. |
|
|
Fields and Data This display includes: |
|||
|
|
State |
The WebSphere server current state:
|
|
|
|
Applications |
The number of applications running on the server. |
|
|
|
PID |
The WebSphere server process identifier. |
|
|
|
Live Sessions |
The current number of active sessions. |
|
|
|
WAS Version |
The WebSphere Application Server software version. |
|
|
|
Java Vendor |
The Java vendor name. |
|
|
|
Java Version |
The Java software version. |
|
|
|
End Time |
Refer to vendor documentation for details. |
|
|
|
Server |
The current alert severity.
|
|
|
|
Application |
The current alert severity.
|
|
|
|
Last Data Time |
The date and time of the last data update. |
|
|
|
CPU |
|
|
|
|
|
System % |
The current amount of CPU used by the system, in percent. |
|
|
|
JVM % |
The current amount of CPU used by the JVM, in percent. |
|
|
|
Uptime |
The number of days, hours and minutes since the server was last started. |
|
|
Heap Memory |
||
|
|
|
Max bytes |
The maximum size of heap memory, in bytes. |
|
|
|
Current bytes |
The current size of heap memory, in bytes. |
|
|
|
Used bytes |
The size of heap memory being used, in bytes. |
|
|
Max System Dumps |
The maximum number of system dumps that are allowed to be performed. |
|
|
|
Max Heap Dumps |
The maximum number of heap dumps that are allowed to be performed. |
|
|
|
Server CPU, Memory, Session Trends The trend graph traces the following for the selected server:
|
||
|
|
|
Log Scale |
Select to enable a logarithmic scale. Use Log Scale to see usage correlations for data with a wide range of values. For example, if a minority of your data is on a scale of tens, and a majority of your data is on a scale of thousands, the minority of your data is typically not visible in non-log scale graphs. Log Scale makes data on both scales visible by applying logarithmic values rather than actual values to the data. |
|
|
Base at Zero |
Use zero as the Y axis minimum for all graph traces. |
|
|
|
Time Range |
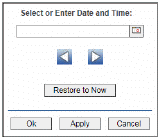
Select a time range from the drop down menu varying from 2 Minutes to Last 7 Days, or display All Data. To specify a time range, click Calendar 
By default, the time range end point is the current time. To change the time range end point, click Calendar Use the navigation arrows Click Restore to Now to reset the time range end point to the current time.
|
|