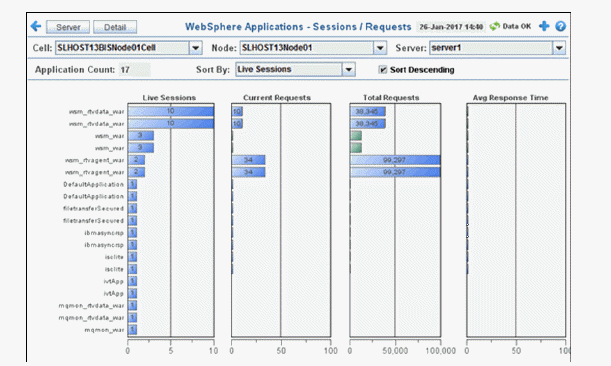
This display shows activity metrics for all web application sessions on a selected server. Choose a cell, node and server from the drop-down menus. Use this display to see metrics for Live Sessions, Current Servlet Requests, Total Servlet Requests and Total JSP Requests, Current JSP Requests and average response times for all web application sessions on a server. By default, this display shows the Live Sessions metric.
Click on an object to drill down to details.


|
Filter By: |
||||
|
|
Cell: |
Choose the cell for which you want to show data. |
||
|
|
Node: |
Choose the node for which you want to show data. |
||
|
|
Server: |
Choose the server for which you want to show data. |
||
|
Fields and Data: |
|
|
|
|
|
|
Application Count |
The number of web applications in the display. |
||
|
|
Sort By: |
Choose a value to sort data in the display: |
||
|
|
|
Name |
The name of the item. |
|
|
|
|
Live Sessions |
The current number of active sessions. |
|
|
|
|
Total Servlet Requests |
The number of servlet requests since the server was started. |
|
|
|
|
Current Servlet Requests |
The current number of servlet requests. |
|
|
|
|
Total JSP Requests |
The number of JSP requests since the server was started. |
|
|
|
|
Current JSP Requests |
The current number of JSP requests. |
|
|
|
|
Servlet Avg Response Time |
The average amount of time for the servlet to respond. |
|
|
|
|
JSP Avg Response Time |
The average amount of time for the JSP to respond. |
|
|
|
Sort Descending |
Select to sort data in descending order. |
||