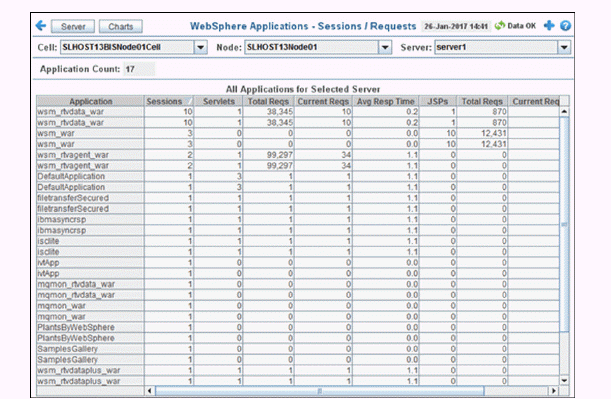
This display shows activity metrics for all web applications on a selected server. Choose a cell, node and server from the drop-down menus. Each row in the table is a different application.


|
Filter By: |
||||
|
|
Cell: |
Choose the cell for which you want to show data. |
||
|
|
Node: |
Choose the node for which you want to show data. |
||
|
|
Server: |
Choose the server for which you want to show data. |
||
|
Fields and Data: |
|
|
|
|
|
|
Application Count |
The number of web applications in the display. |
||
|
All Applications Table Column values describe the application. |
||||
|
|
Application |
The name of the application. |
||
|
|
Sessions |
The number of current sessions. |
||
|
|
Servlets |
The number of servlets. |
||
|
|
Total Reqs |
The number of requests since the application was started. |
||
|
|
Current Reqs |
The number of current requests. |
||
|
|
Avg Resp Time |
The average response time, in seconds. |
||
|
|
JSPs |
The number of JSPs. |
||
|
|
Total Reqs |
The number of requests since the application was started. |
||
|
|
Current Reqs |
The number of current requests. |
||
|
|
Total Reqs |
The number of requests since the application was started. |
||
|
|
Current Reqs |
The number of current requests. |
||
|
|
Avg Resp Time |
The average response time, in seconds. |
||