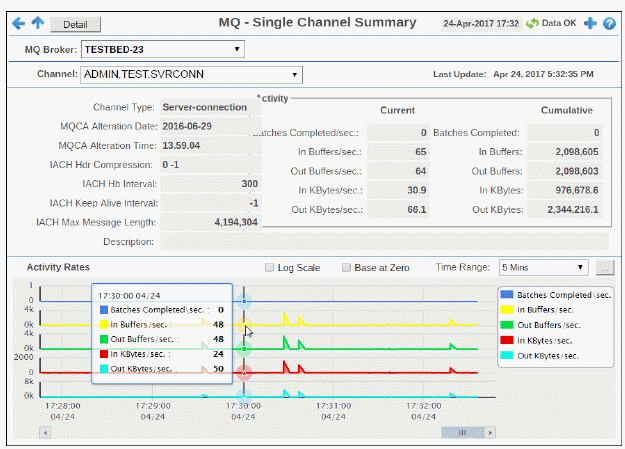
View current and historical activity rates and transmission settings for a single MQ channel. Metrics include buffers received/sent per second and batches completed. Parameter settings such as MQCA Alteration date, IACH Keep Alive Interval and Max Message Length are shown.
Use this display to check the health of a channel and its configuration.
Note: This display contains vendor data. Refer to vendor documentation for details.


|
MQ Broker |
Choose a broker to display. |
||
|
Channel |
Choose a channel to display. |
||
|
Last Update |
The date and time of the last data update. |
||
|
|
Channel Type |
The type of channel. |
|
|
Vendor Data |
|||
|
This display contains vendor data. Refer to vendor documentation for details. |
|||
|
Activity Rates Trend Graph Values describe the selected channel. |
|||
|
|
|
Current |
Cumulative |
|
|
Batches Completed/sec |
The current number of batches completed per second. |
The total number of batches completed since the channel started. |
|
|
In Buffers/sec |
The current number of buffers received per second. |
The total number of buffers received since the channel started. |
|
|
Out Buffers/sec |
The current number of buffers sent per second. |
The total number of buffers sent since the channel started. |
|
|
In KBytes/sec |
The current number of kilobytes received per second. |
The tota number of kilobytes received since the channel started. |
|
|
Out KBytes/sec |
The current number of kilobytes sent per second. |
The tota number of kilobytes sent since the channel started. |
|
Activity Rates Traces the following for the selected channel:
|
|||
|
|
Log Scale |
Select to enable a logarithmic scale. Use Log Scale to see usage correlations for data with a wide range of values. For example, if a minority of your data is on a scale of tens, and a majority of your data is on a scale of thousands, the minority of your data is typically not visible in non-log scale graphs. Log Scale makes data on both scales visible by applying logarithmic values rather than actual values to the data. |
|
|
|
Base at Zero |
Select to use zero as the Y axis minimum for all graph traces. |
|
|
|
Time Range |
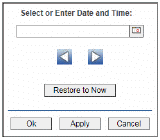
Select a time range from the drop down menu varying from 2 Minutes to Last 7 Days, or display All Data. To specify a time range, click Calendar 
By default, the time range end point is the current time. To change the time range end point, click Calendar Use the navigation arrows Click Restore to Now to reset the time range end point to the current time.
|
|