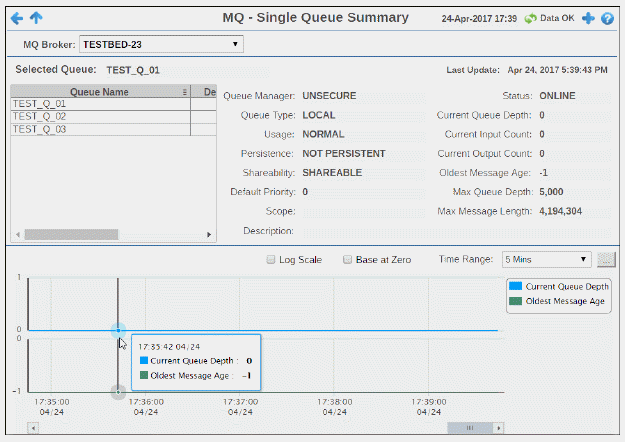
View detailed performance metrics and settings for a single IBM MQ queue. Metrics include input/output counts, queue depth and max message length. Settings such as persistence, shareability, and scope are shown. Trend graph traces current queue depth and the oldest message age for the selected queue.
Choose a broker from the drop-down menu, then choose a queue from the Queue table.
Use this display to check the health of a queue and its configuration.
Note: This display contains vendor data. Refer to vendor documentation for details.


|
MQ Broker |
Choose a broker to display. |
||
|
Selected Queue |
Choose a queue from the table to populate the display. The name of the queue selected in the Queue table (below). |
||
|
Last Update |
The data and time of the last data update. |
||
|
Queue Table |
Choose a queue to populate the display. |
||
|
|
Queue Name |
The queue name. |
|
|
|
Depth |
The current queue depth. |
|
|
|
Status |
The current queue status. |
|
|
|
Inputs |
The current number of incoming transactions for the queue. |
|
|
|
Outputs |
The current number of outgoing transactions for the queue. |
|
|
Queue Manager |
The name of the queue manager for the queue. |
||
|
Queue Type |
The type of queue. |
||
|
Usage |
The queue usage type (NORMAL/TRANSMISSION). |
||
|
Persistence |
Denotes whether or not the queue manager is persistent (PERSISTENT/NOT PERSISTENT). |
||
|
Shareability |
Denotes whether or not the queue manager is shareable (SHAREABLE/NOT SHAREABLE). |
||
|
Default Priority |
The default priority setting on the queue manager. |
||
|
Scope |
The defined scope for the queue. |
||
|
Description |
The description of the queue. |
||
|
Status |
The status of the queue. |
||
|
Current Queue Depth |
The current depth of the queue. |
||
|
Current Input Count |
The number of incoming transactions. |
||
|
Current Output Count |
The number of outgoing transactions. |
||
|
Oldest Message Age |
The age of the oldest message in the queue. |
||
|
Max Queue Depth |
The maximum number of messages allowed on the queue. |
||
|
Max Message Length |
The maximum message length on the queue. |
||
|
Trend Graph Traces the following for the selected queue:
|
|||
|
|
Log Scale |
Select to enable a logarithmic scale. Use Log Scale to see usage correlations for data with a wide range of values. For example, if a minority of your data is on a scale of tens, and a majority of your data is on a scale of thousands, the minority of your data is typically not visible in non-log scale graphs. Log Scale makes data on both scales visible by applying logarithmic values rather than actual values to the data. |
|
|
|
Base at Zero |
Select to use zero as the Y axis minimum for all graph traces. |
|
|
|
Time Range |
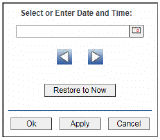
Select a time range from the drop down menu varying from 2 Minutes to Last 7 Days, or display All Data. To specify a time range, click Calendar 
By default, the time range end point is the current time. To change the time range end point, click Calendar Use the navigation arrows Click Restore to Now to reset the time range end point to the current time.
|
|