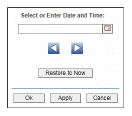
 to specify your own. Mouse-over to see additional details.
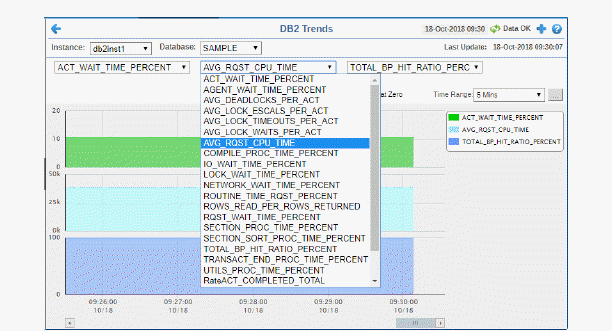
View IBM DB2 database performance and utilization metrics in a trend graph. Select an Instance, a Database and up to three IBM DB2 metrics. Metric options include (among others) ACT_WAIT_CPU_TIME, AVG_LOCK_TIMEOUTS, ROWS_READ_PER_ROWS_RETURNED and UTILS_PROC_TIME_PERCENT.
Choose a Time Range or click  to specify your own. Mouse-over to see additional details.


|
|
Log Scale |
Select to enable a logarithmic scale. Use Log Scale to see usage correlations for data with a wide range of values. For example, if a minority of your data is on a scale of tens, and a majority of your data is on a scale of thousands, the minority of your data is typically not visible in non-log scale graphs. Log Scale makes data on both scales visible by applying logarithmic values rather than actual values to the data.
|
||
|
|
Base at Zero |
Select to use zero (0) as the Y axis minimum for all graph traces. |
||
|
|
Time Range |
Select a time range from the drop down menu varying from 2 Minutes to Last 7 Days, or display All Data. By default, the time range end point is the current time. To enter a specific time range, click the associated ellipsis button 
To change the time range click the Open Calendar button
|
||