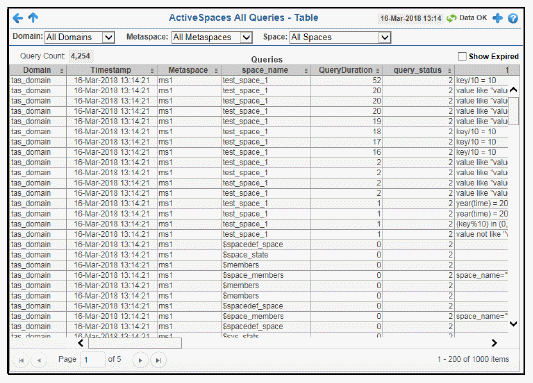
This display allows you to view queries by domain, metaspace, and space and view the performance metrics for the queries. Clicking on a query in the table opens the “Query Summary” display.


Note: Fields/columns with an asterisk (*) at the end of the field/column definition contain data that is provided by the selected domain. Refer to TIBCO ActiveSpaces documentation for more information regarding these fields.
|
Filter By: The display might include these filtering options: |
||||
|
|
Domain |
Select the domain for which you want to show data in the display. |
||
|
|
Metaspace |
Select the metaspace for which you want to show data in the display. |
||
|
|
Space |
Select the space for which you want to show data in the display. |
||
|
Fields and Data: |
||||
|
|
Query Count |
The total number of queries listed in the table. |
||
|
|
Show Expired |
Select this toggle to display expired queries in the table. |
||
|
Queries Table |
||||
|
|
Domain |
The name of the domain containing the query. |
||
|
|
Timestamp |
The date and time that the row in the table was last updated. |
||
|
|
Metaspace |
The name of the metaspace containing the query. |
||
|
|
space_name |
The name of the space containing the query. |
||
|
|
Query Duration |
The duration, in seconds, of the query.* |
||
|
|
query_status |
The status of the query.* 0 - Failed 1 - In progress 2 - Completed |
||
|
|
filter |
The filter used in the query.* |
||
|
|
query_type |
The type of query.* |
||
|
|
scan_type |
Lists whether the query used a table scan or an index scan.* |
||
|
|
index_name |
The name of the index being used in the query.* |
||
|
|
limit |
Lists the maximum number of entries that can be returned when executing a query.* |
||
|
|
estimated_cost |
The estimated execution time of the query.* |
||
|
|
actual_cost |
The actual execution time of the query.* |
||
|
|
abort |
When checked, denotes that the query was aborted.* |
||
|
|
StartTime |
Start time of the query. |
||
|
|
EndTime |
End time of the query. |
||
|
|
start_time |
Internal start time of the query.* |
||
|
|
end_time |
Internal end time of the query.* |
||
|
|
request_id |
The request id of the query.* |
||
|
|
parent_request_id |
The request id of the query’s parent.* |
||
|
|
member_name |
The name of the member node.* |
||
|
|
member_id |
The id of the member node.* |
||
|
|
process_id |
The process ID of the member node processing the query.* |
||
|
|
Expired |
When checked, performance data has not been received within the time specified (in seconds) in the Expire Time field in the Duration region in the RTView Configuration Application > (Project Name) > Solution Package Configuration > TIBCO Active Spaces > DATA STORAGE tab. The Delete Time field (also in the Duration region) allows you to define the amount of time (in seconds) in which the row will be removed from the table if there is no response. |
||