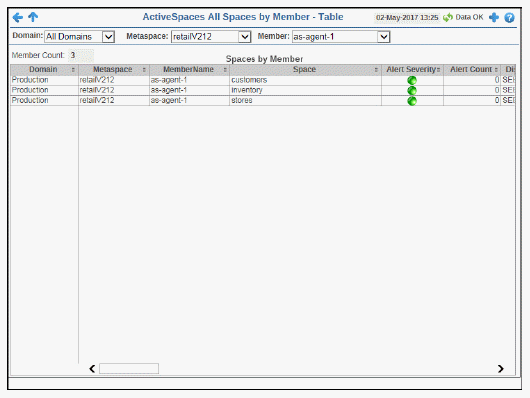
The table in this display provides a view of all of your spaces (by member name) and the their associated metric data including domain, metaspace, space, alert severity, alert count, and the current value of each gathered metric. You can click a column header to sort column data in numerical or alphabetical order, and drill-down and investigate by clicking a row to view details for the selected member in the “Member by Space Summary” display.


Note: Fields/columns with an asterisk (*) at the end of the field/column definition contain data that is provided by the selected domain. Refer to TIBCO ActiveSpaces documentation for more information regarding these fields.
|
Filter By: |
||||
|
|
Domain |
Select the domain for which you want to view data. |
||
|
|
Metaspace |
Select the metaspace for which you want to view data. |
||
|
|
Member |
Select the space for which you want to view data. |
||
|
Member Count |
The resulting total number of members found in the filtered query, which are listed in the Spaces by Members table. |
|||
|
Spaces by Member Table |
||||
|
|
Domain |
The name of the domain. |
||
|
|
Metaspace |
The name of the metaspace. |
||
|
|
Member Name |
The name of the member. |
||
|
|
Space |
The name of the space. |
||
|
|
Alert Severity |
The current alert severity.
|
||
|
|
Alert Count |
The total number of alerts for the host. |
||
|
|
Distribution Role |
The member’s role within the space. |
||
|
|
Entries |
The number of entries.* |
||
|
|
% Capacity |
The percentage of available entries used for the space. |
||
|
|
Replicas |
The number of replicas.* |
||
|
|
Gets |
The total number of “get” operations performed on the user-spaces defined on the metaspace.* |
||
|
|
Gets/interval |
The number of “get” operations performed on the user-spaces defined for the metaspace during the current polling interval.* |
||
|
|
Gets/sec |
The rate of “get” operations (per second) performed on the user-spaces defined for the metaspace.* |
||
|
|
Puts |
The total number of “put” operations performed on the user-spaces defined on the metaspace.* |
||
|
|
Puts/interval |
The number of “put” operations performed on the user-spaces defined for the metaspace during the current polling interval.* |
||
|
|
Puts/sec |
The rate of “put” operations (per second) performed on the user-spaces defined for the metaspace.* |
||
|
|
Takes |
The total number of “take” operations performed on the user-spaces defined on the metaspace.* |
||
|
|
Takes/interval |
The number of “take” operations performed on the user-spaces defined for the metaspace during the current polling interval.* |
||
|
|
Takes/sec |
The rate of “take” operations (per second) performed on the user-spaces defined for the metaspace.* |
||
|
|
Expires |
The total number of entries in the user-spaces defined on the metaspace that have expired.* |
||
|
|
Expires/interval |
The number of entries performed in the user-spaces defined for the metaspace that expired during the current polling interval.* |
||
|
|
Expires/sec |
The rate of entries in the user-spaces defined for the metaspace that expired (per second).* |
||
|
|
Evicts |
The total number of entries in the user-spaces defined on the metaspace that have been evicted.* |
||
|
|
Evicts/interval |
The number of entries performed in the user-spaces defined for the metaspace that were evicted during the current polling interval.* |
||
|
|
Evicts/sec |
The rate of entries in the user-spaces defined for the metaspace that were evicted (per second).* |
||
|
|
Locks |
The total number of locks in the user-spaces defined for the metaspace.* |
||
|
|
Unlocks |
The total number of unlocks in the user-spaces defined for the metaspace.* |
||
|
|
Invokes |
The remote invocation count.* |
||
|
|
Queries |
The total number of queries in the user-spaces defined for the metaspace.* |
||
|
|
Misses |
The total number of misses in the user-spaces defined for the metaspace.* |
||
|
|
ToPersist |
The ToPersist count, which indicates how many tuples are required to be persisted to the database if the write-behind feature is configured.* |
||
|
|
ClientAvgGetMicros |
The client’s average “get” latency in microseconds.* |
||
|
|
ClientAvgPutMicros |
The client’s average “put” latency in microseconds.* |
||
|
|
ClientAvgTakeMicros |
The client’s average “take” latency in microseconds.* |
||
|
|
ClientMaxGetMicros |
The client’s highest “get” latency in microseconds.* |
||
|
|
ClientMaxPutMicros |
The client’s highest “put” latency in microseconds.* |
||
|
|
ClientMaxTakeMicros |
The client’s highest “take” latency in microseconds.* |
||
|
|
ClientTotalGetMillis |
The client’s cumulative total “get” latency in milliseconds for the current polling period.* |
||
|
|
ClientTotalPutMillis |
The client’s cumulative total “put” latency in milliseconds for the current polling period.* |
||
|
|
ClientTotalTakeMillis |
The client’s cumulative total “take” latency in milliseconds for the current polling period.* |
||
|
|
ClientTotalMissMillis |
The client’s cumulative total “miss” latency in milliseconds for the current polling period.* |
||
|
|
Expired |
When checked, performance data has not been received within the time specified (in seconds) in the Expire Time field in the Duration region in the RTView Configuration Application > (Project Name) > Solution Package Configuration > TIBCO Active Spaces > DATA STORAGE tab. The Delete Time field (also in the Duration region) allows you to define the amount of time (in seconds) in which the row will be removed from the table if there is no response. |
||
|
|
Timestamp |
The date and time the row data was last updated. |
||