 both global and override alerts.
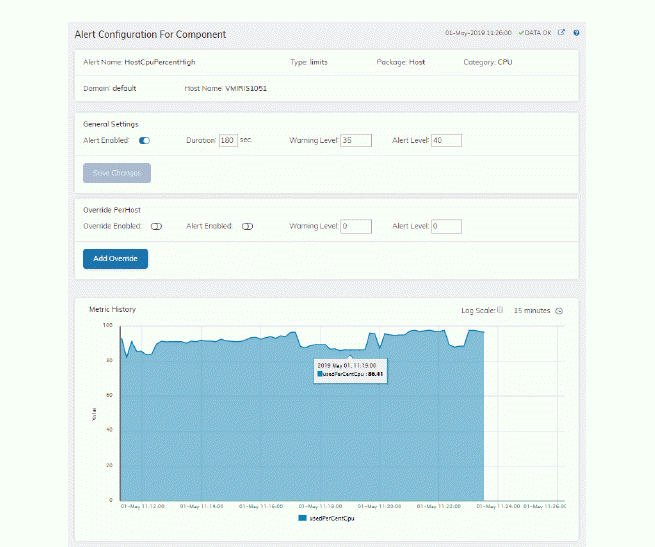
Use the Alert Configuration for Component display to see, modify and refine alert threshold settings for a particular alert. A trend graph traces the history of the relevant metric for this alert so you can adjust thresholds in real-time. You can also modify alert thresholds, add an override alert and toggle ON or OFF  both global and override alerts.
Access the Alert Configuration for Component display by clicking  in the Alert Detail for Component display.
The bottom half of the display provides a Metric History trend graph which traces the performance metric pertaining to the alert. You can hover over the trend graph to see the values at a particular time. You can specify the time range for the trend graph and view data based on a log scale, which enables visualization on a logarithmic scale and should be used when the range in your data is very broad.
You must be logged in as rtvalertmgr or rtvadmin to modify alerts.
