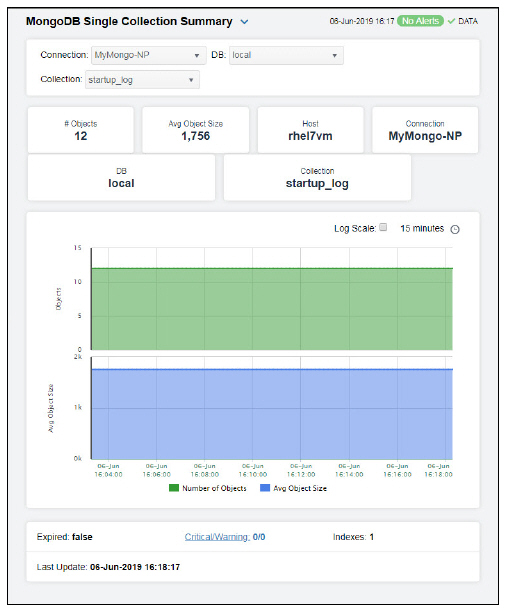
Clicking Single Collection Summary in the left/navigation menu opens the MongoDB Collection Summary display, which allows you to track performance and utilization metrics for a single collection on a single database. Clicking on the information boxes at the top of the display takes you to the MongoDB Collections Table - HTML display, where you can view additional database data.
The trend graph allows you to view trend data for the number of objects and average object size over a selected time range.
Clicking the Critical/Warning link at the bottom of the display opens the Alerts Table by Component display.