 in the Alerts Table or
  in the Alerts Table by Component display.
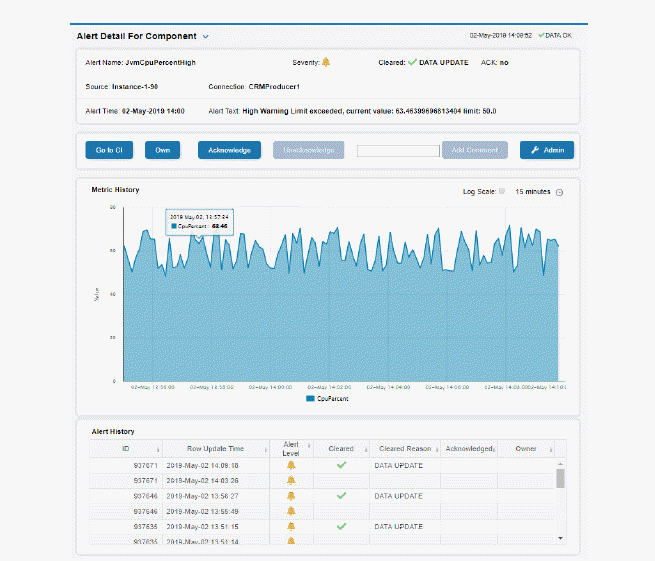
Use the Alert Detail for Component display to investigate current and historical activity of a specific alert instance as it applies to the associated CI, and also compare against Metric History trends of the associated CI. A trend graph for the CI associated with the alert instance. You can hover over the trend graph to see the values at a particular time. You can specify the time range for the trend graph and view data based on a log scale, which enables visualization on a logarithmic scale and should be used when the range in your data is very broad.
Access the Alert Detail for Component display by clicking  in the Alerts Table or
  in the Alerts Table by Component display.
The Alert History table at the bottom of the display contains a row of data for each time the alert instance was updated. See the alert ID, Row Update Time, Cleared status and Reason, Owner and the Alert Level column icon, where:
|
|
|
The alert reached its ALARM LEVEL threshold in the table row. |
|
|
|
|
The alert reached its WARNING LEVEL threshold in the table row. |
|
You can search, filter, sort and choose columns to include by clicking a column header icon (to the right of each column label) and selecting Filter, Sort Ascending, Sort Descending or Columns. Right-click on a table cell to Export to Excel. Use Ctrl + click or Shift + click to select multiple alerts.
To investigate, click:
 to see utilization conditions for the CI associated with the alert in a summary display.
 to open the Alert Configuration for Component display where you can see, modify and refine alert threshold settings for that particular alert. A trend graph traces the relevant alert metric for the CI so you can adjust thresholds in real-time.
