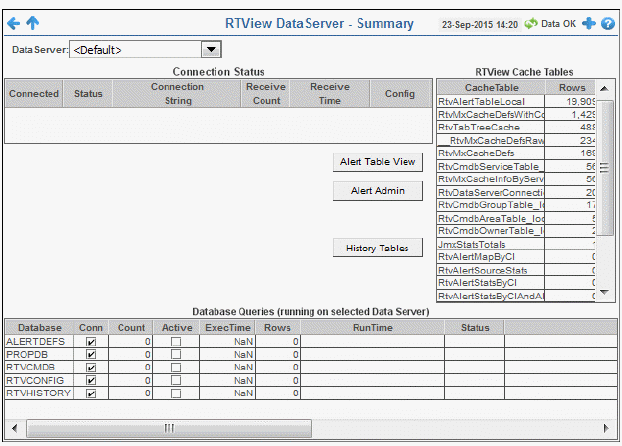
View Data Server connection status, cache table sizes and database query metrics. Use the available drop-down menus or right-click to filter data shown in the display. For details about the HTML version of this display, see Data Server Summary - HTML
|
Fields and Data This display includes: |
|||
|
|
Data Server |
Select a Data Server from the drop-down menu to view details for in the display. |
|
|
|
Connection Status This table shows connection details for the selected Data Server. |
||
|
|
|
Connected |
When checked, the Data Server is currently connected. |
|
|
Status |
The Data Server connection status. |
|
|
|
Connection String |
The host name and port number for TCP connections, or the URL for servlet connections. |
|
|
|
Rcv Cnt |
The number of data updates received from that Data Server. |
|
|
|
ReceiveTime |
The time that data was last received. |
|
|
|
Config |
The RTView version running on the Data Server. |
|
|
|
Alert Table View |
Select to view or manage current alerts for the selected Data Server in the RTView Alerts Table display. |
|
|
|
Alert Admin |
Select to view or manage alert thresholds for the selected Data Server in the Alert Administration display. |
|
|
|
History Tables |
Select to view database table statistics for each cache for the selected Data Server in the RTView History Table Statistics display. |
|
|
|
RTView Cache Tables This table lists Cache Tables and their size, in number of rows, for the selected Data Server. Select a Cache Table to view details in the RTView Cache Tables display. Use this data for debugging. This display is typically used for troubleshooting with SL Technical Support. |
||
|
|
|
CacheTable |
The name of the Cache Table. |
|
|
|
Rows |
The current number of rows in the Cache Table. |
|
|
Database Queries This table lists the databases and query details for the selected Data Server. Each table row describes a different query. |
||
|
|
|
Database |
The name of the database. |
|
|
|
Conn |
When checked, the database is currently connected. |
|
|
|
Count |
The number of query requests from current Data Server. |
|
|
|
Active |
When checked, the query is currently running. |
|
|
|
ExecTime |
The amount of time, in milliseconds, to execute the query. |
|
|
|
Rows |
The number of rows the query created. |
|
|
|
RunTime |
The time the query was executed. |
|
|
|
Status |
The latest result status of the query. |
|
|
|
Query |
The query that was executed. |