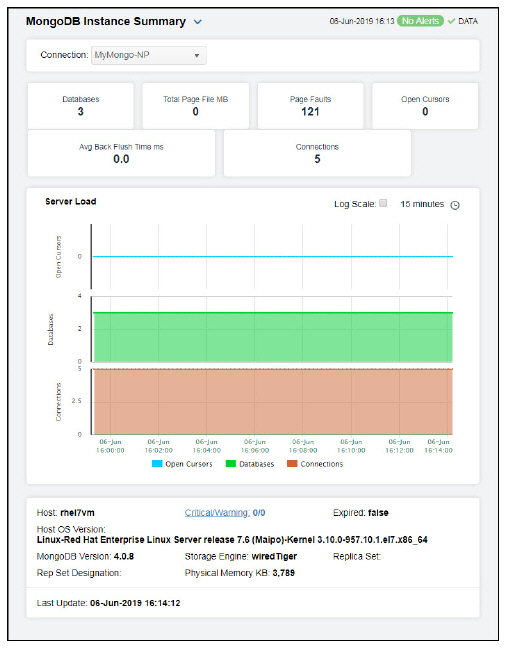
Clicking Single Instance Summary in the left/navigation menu opens the MongoDB Instance Summary display, which allows you to view current as well as trending data for specific instances. Clicking on the information boxes at the top of the display takes you to the MongoDB Instances Table display, where you can view additional instance data.
The Server Load trend graph allows you to view trend data for the open cursors, databases, and connections over a selected time range.
Clicking the Critical/Warning link at the bottom of the display opens the Alerts Table by Component display.