DB2 Members View
Displays in this View are:
| • | DB2 Members Table: Get configuration details and utilization metrics for host members of an instance. |
| • | DB2 Member Summary: View trend graph for CPU load and CPU utilization for each member of an instance. |
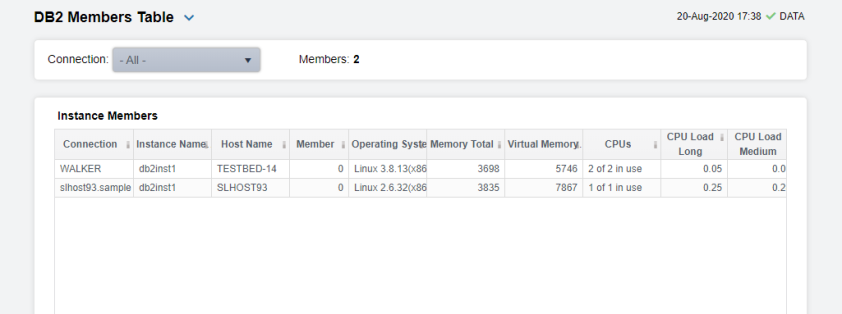
DB2 Members Table
Select an instance Instance to see a list of all host members of an instance.
Each row is a different host that shows configuration details and utilization metrics for each. Details include OS, RAM, CPU load (short, medium, long) and virtual memory.
Click a column header to sort column data in numerical or alphabetical order. Drill-down and investigate by clicking a row to view details for a host member in the DB2 Member Summary display.
|
Instance Members Table Each row is a different host member. Column values describe the host. |
||||
|
Member Count: |
The number of members in the table. |
|||
|
|
Host Name |
The name of the host. |
||
|
|
Expired |
When checked, performance data has not been received within the time specified by your administrator for the Expire Time. If your administrator has also set the Delete Time, this row will be deleted if no data is received within the time specified for deletion. |
||
|
|
Instance |
The name of the instance that the host is a member of. |
||
|
|
Member |
The name of the member. |
||
|
|
OS |
The installed operating system. |
||
|
|
CPUs |
The number of CPUs and the number of CPUs in use. |
||
|
|
CPU Speed |
The processor speed. |
||
|
|
Total RAM |
The total amount of RAM, in megabytes. |
||
|
|
Total Virtual Memory |
The total amount of virtual memory, in megabytes. |
||
|
|
CPU Load Short |
Amount of processor load over the short term (defined by the IBM DB2 system, for example, 1-5 minutes). |
||
|
|
CPU Load Medium |
Amount of processor load over the medium term (defined by the IBM DB2 system, for example, 5-10 minutes). |
||
|
|
CPU Load Long |
Percentage of CPU load over the long term (defined by the IBM DB2 system, for example, 10-15 minutes). |
||
|
|
% CPU Usage |
The percentage of CPU used. |
||
|
|
Timestamp |
The data and time this data was last updated. |
||
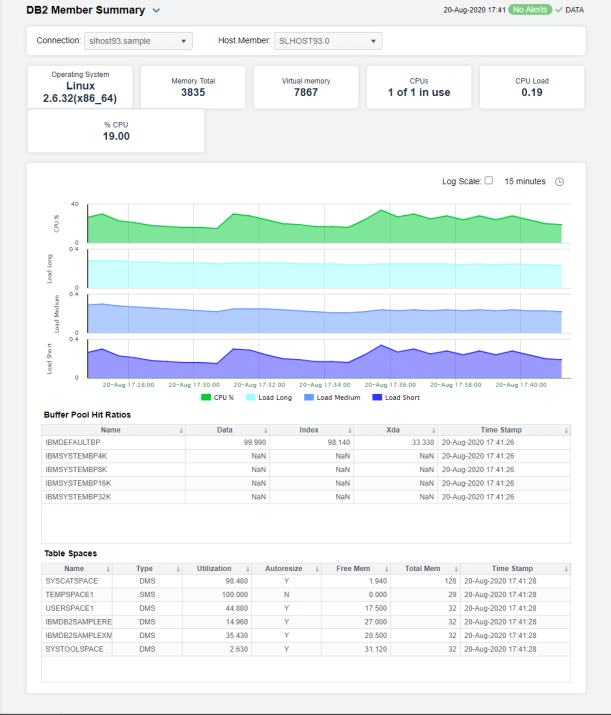
DB2 Member Summary
Use this display to study trends for a single host member, such as CPU usage and loads (Short, Medium and Long).
Select an Instance and a Member from the drop-down menus. Check status of the selected host member TableSpace allocations and current Buffer Pool Hit Ratios.
Choose a Time Range or click  to specify your own. Mouse-over to see additional details.
|
Instance: |
Choose an instance. |
|||||||||||||||
|
Member: |
Choose a member. |
|||||||||||||||
|
|
Expired |
When checked, performance data has not been received within the time specified by your administrator for the Expire Time. If your administrator has also set the Delete Time, this row will be deleted if no data is received within the time specified for deletion. |
||||||||||||||
|
|
Host Name |
The name of the selected host member. |
||||||||||||||
|
|
OS |
The operating system on the selected host member. |
||||||||||||||
|
|
Buffer Pool Hit Ratios Each row in the table in a different buffer pool. Values describe values for the selected host member. |
|||||||||||||||
|
|
|
BP_NAME |
The name of the buffer pool. |
|||||||||||||
|
|
|
Data |
|
|||||||||||||
|
|
|
Index |
|
|
||||||||||||
|
|
|
Xda |
|
|
||||||||||||
|
|
TableSpace Values describe TableSpace values for the selected host member. |
|||||||||||||||
|
|
|
TableSpace |
The name of the TableSpace. |
|||||||||||||
|
|
|
% Utilization |
The percentage of TableSpace used. |
|||||||||||||
|
|
|
Allocated |
The amount of TableSpace allocated. |
|||||||||||||
|
|
|
Free(MB) |
The amount of free TableSpace, in megabytes. |
|||||||||||||
|
|
|
Auto Extend |
Indicates whether auto extend is enabled. Y/N |
|||||||||||||
|
Trend Graph For the selected host member, trend graphs trace as follows:
|
||||||||||||||||
|
|
Log Scale |
Select to enable a logarithmic scale. Use Log Scale to see usage correlations for data with a wide range of values. For example, if a minority of your data is on a scale of tens, and a majority of your data is on a scale of thousands, the minority of your data is typically not visible in non-log scale graphs. Log Scale makes data on both scales visible by applying logarithmic values rather than actual values to the data.
|
||||||||||||||
|
|
Base at Zero |
Select to use zero (0) as the Y axis minimum for all graph traces. |
||||||||||||||
|
|
Time Range |
Select a time range from the drop down menu varying from 2 Minutes to Last 7 Days, or display All Data. By default, the time range end point is the current time. To enter a specific time range, click the associated ellipsis button
To change the time range click the Open Calendar button
|
||||||||||||||