IBM MQ Subscriptions View
This View contains displays that allow you to view performance and utilization metrics for all of your IBM MQ subscriptions. Clicking IBM MQ Subscriptions in the left/navigation menu opens the IBM MQ Subscriptions Table display, which allows you to view current alert status and performance metrics based on the total subscriptions on a specific MQ broker in a table format.
| • | IBM MQ Subscriptions Heatmap: Clicking MQ Subscriptions Heatmap in the left/navigation menu opens this display, which allows you to view current alert status and performance metrics based on the total subscriptions on a specific MQ broker in a heatmap format. |
| • | IBM MQ Subscription Summary: Clicking MQ Subscriptions Summary in the left/navigation menu opens this display, which allows you to view current alert status and performance metrics for a specific subscription on a specific MQ broker. |
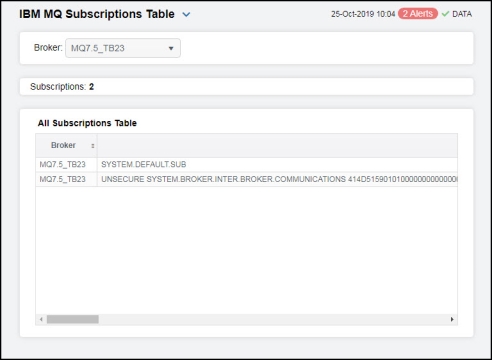
IBM MQ Subscriptions Table
This display allows you to view current alert status and performance metrics based on the total subscriptions on a specific MQ broker in a table format.
Each row in the table contains data for a particular subscription. You can search, filter, sort and choose columns to include by clicking a column header icon (to the right of each column label) and selecting Filter, Sort Ascending, Sort Descending or Columns.
You can also click any column header to sort and compare the values that interest you. Right-click on a table cell to Export to Excel or Copy Cell Value.
Investigate a subscription by double-clicking a row, which opens the IBM MQ Subscription Summary display.
|
Filter By: |
||||
|
|
Broker: |
Select the broker for which you want to view data or select All to view subscriptions for all brokers. |
||
|
Subscriptions |
The number of subscriptions found on the broker and listed in the table. |
|||
|
All Subscriptions Table |
||||
|
|
Broker |
The name of the broker. |
||
|
|
Name |
The name of the subscription. |
||
|
|
Subscription ID |
The ID of the subscription. |
||
|
|
Alert Level |
The current alert severity.
|
||
|
|
Alert Count |
The total number of critical and warning alerts. |
||
|
|
Active Connection |
The currently active ConnectionId (CONNID) associated with the handle that has this topic open for publish. |
||
|
|
Delta Message Count |
The number of messages since the last data update. |
||
|
|
Deltatime_stamp |
The difference in time (in milliseconds) between the most recent update (Last Update/Timestamp) and the previous update. |
||
|
|
Durable |
When NO, the subscription is removed when the application that created it is closed or disconnected from the queue manager. When YES, the subscription persists even when the creating application is no longer running or has been disconnected. The subscription is reinstated when the queue manager is restarted. |
||
|
|
Last Message Date |
The date that a message was last sent to the destination specified by the subscription. |
||
|
|
Last Message Time |
The time when a message was last sent to the destination specified by the subscription. |
||
|
|
Message Count |
The number of messages put to the destination that are specified by this subscription. |
||
|
|
Multicast Reliability Indicator |
The multicast reliability indicator. |
||
|
|
RateMessage Count |
The rate of messages put to the destination specified by this subscription. |
||
|
|
Resume Date |
The date of the most recent MQSUB API call that connected to this subscription. |
||
|
|
Resume Time |
The time of the most recent MQSUB API call that connected to this subscription. |
||
|
|
Subscription Type |
The type of subscription, which indicates how the subscription was created. |
||
|
|
Subscription User |
The user ID that owns the subscription. |
||
|
|
TopicString |
The name of the topic string. |
||
|
|
Expired |
When checked, performance data has not been received in the time specified in the Duration region on the RTView Configuration Application > Solution Package Configuration > IBM MQ > DATA STORAGE tab. |
||
|
|
Timestamp |
The date and time of the last data update. |
||


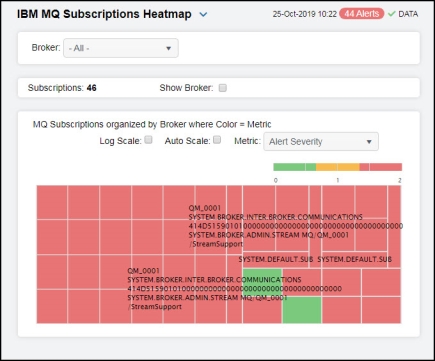
IBM MQ Subscriptions Heatmap
This display allows you to view current alert status and performance metrics based on the total subscriptions on a specific MQ broker in a heatmap format.
Each rectangle in the heatmap represents a different subscription, where the rectangle color indicates the most critical alert state for items associated with that subscription, and the rectangle size represents the tablespace allocation size for the subscription.
Each metric has its own color gradient bar legend that maps values to colors. By default, the Alert Severity metric is shown, which is the current alert severity for items associated with the rectangle. Values range from 0 - 2, as indicated in the color gradient  bar:
bar:
 (2) Red indicates that one or more metrics exceeded their ALARM LEVEL threshold.
 (1) Yellow indicates that one or more metrics exceeded their WARNING LEVEL threshold.
 (0) Green indicates that no metrics have exceeded their alert thresholds.
Use the Show Broker check-box  to include or exclude labels in the heatmap, use the Log Scale check-box
  to apply log scale, and mouse over a rectangle to see additional metrics. Click a rectangle to drill down on an instance in the IBM MQ Subscription Summary display.
|
Filter By: |
||||
|
|
Broker: |
Select the MQ broker for which you want to view data. |
||
|
Fields and Data |
||||
|
|
Subscriptions |
The number of subscriptions found in the filter and listed in the heatmap. |
||
|
|
Show Broker |
Select this check box to display the name of the broker at the top of each rectangle in the heatmap. |
||
|
|
Log Scale |
Select this check box to enable a logarithmic scale. Use Log Scale to see usage correlations for data with a wide range of values. For example, if a minority of your data is on a scale of tens, and a majority of your data is on a scale of thousands, the minority of your data is typically not visible in non-log scale graphs. Log Scale makes data on both scales visible by applying logarithmic values rather than actual values to the data. |
||
|
|
Auto Scale |
Select to enable auto-scaling. When auto-scaling is activated, the color gradient bar's maximum range displays the highest value. Note: Some metrics auto-scale automatically, even when Auto Scale is not selected. |
||
|
|
Metric |
Choose a metric to view in the display. For details about the data, refer to vendor documentation. |
||
|
|
|
Alert Severity |
The current alert severity for items associated with the rectangle. Values range from 0 - 2, as indicated in the color gradient
|
|
|
|
|
Alert Count |
The total number of critical and warning unacknowledged alerts for items associated with the rectangle. The color gradient |
|
|
|
|
Rate Message Count |
The rate of messages put to the destination specified by the subscription. The color gradient |
|


 bar, populated by the current heatmap, shows the value/color mapping. The numerical values in the gradient bar range from 0 to the maximum number of published topics in the heatmap. The middle value in the gradient bar indicates the middle value of the range.
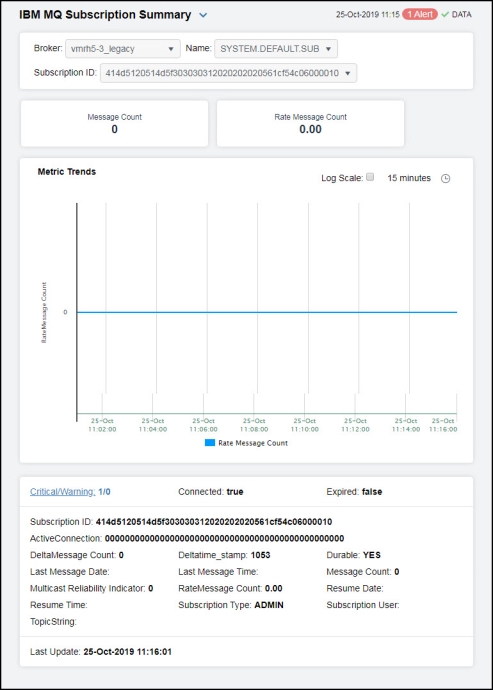
IBM MQ Subscription Summary
This display allows you to view current alert status and performance metrics for a specific subscription on a specific MQ broker or all subscriptions on all brokers. Select a broker, a subscription, and a subscription ID from the drop-down menus to view data for the selected subscription. Clicking on the Message Count and Rate Message Count information boxes at the top of the display opens the IBM MQ Subscriptions Table display, where you can sort and compare the performance values of all subscriptions.
The trend graph traces the Metric Trends (Rate Message Count) for the selected subscription. You can specify the time range for the trend graph and view data based on a log scale, which enables visualization on a logarithmic scale and should be used when the range in your data is very broad.
Clicking the Critical/Warning link at the bottom of the display opens the Alerts Table by Component display. You can hover over the trend graph to see the values at a particular time.
|
Filter By: |
||||
|
|
Broker: |
Select the MQ broker for which you want to view data. |
||
|
|
Name |
Select the name of the subscription for which you want to view data. |
||
|
|
Subscription ID |
Select the subscription ID for which you want to view data. |
||
|
Fields and Data |
||||
|
|
Message Count |
The number of messages put to the destination that are specified by this subscription. |
||
|
|
Rate Message Count |
The rate of messages put to the destination that are specified by this subscription. |
||
|
Metric Trends Graph |
Traces the following for the selected topic: Rate Message Count: Traces the rate of messages put to the destination specified by this subscription. |
|||
|
|
|
Log Scale |
Select to enable a logarithmic scale. Use Log Scale to see usage correlations for data with a wide range of values. For example, if a minority of your data is on a scale of tens, and a majority of your data is on a scale of thousands, the minority of your data is typically not visible in non-log scale graphs. Log Scale makes data on both scales visible by applying logarithmic values rather than actual values to the data. |
|
|
|
|
Time Settings |
Select a time range from the drop down menu varying from 5 Minutes to Last 7 Days. By default, the time range end point is the current time.
To change the time range, deselect the now toggle, which displays some additional date fields. You can click the left and right arrow buttons to decrease the end time by one time period (the time selected in the Time range drop down) per click, or you can choose the date and time from the associated calendar and clock icons. You can also enter the date and time in the text field using the following format: MMM dd, YYYY HH:MM:ss. For example, Aug 21, 2018 12:24 PM. Click the now toggle to reset the time range end point to the current time.
|
|
|
Critical/Warning |
The total number of critical and warning alerts. |
|||
|
Connected |
When checked, denotes that the broker is connected. |
|||
|
Expired |
When checked, performance data has not been received in the time specified in the Duration region on the RTView Configuration Application > Solution Package Configuration > IBM MQ > DATA STORAGE tab. |
|||
|
Subscription ID |
The ID of the subscription. |
|||
|
Active Connection |
The ConnId of the HConn that currently has this subscription open. |
|||
|
Delta Message Count |
The number of messages put to the destination that are specified by this subscription since the last data update. |
|||
|
Last Message Date |
The date that a message was last sent to the destination specified by the subscription. |
|||
|
Multicast Reliability Indicator |
The multicast reliability indicator. |
|||
|
Resume Time |
The time of the most recent MQSUB API call that connected to this subscription. |
|||
|
Topic String |
The name of the topic string. |
|||
|
Deltatime_stamp |
The difference in time (in milliseconds) between the most recent update (Last Update/Timestamp) and the previous update. |
|||
|
Last Message Time |
The time when a message was last sent to the destination specified by the subscription. |
|||
|
RateMessage Count |
The rate of messages put to the destination specified by this subscription. |
|||
|
Subscription Type |
The type of subscription, which indicates how the subscription was created. |
|||
|
Durable |
When NO, the subscription is removed when the application that created it is closed or disconnected from the queue manager. When YES, the subscription persists even when the creating application is no longer running or has been disconnected. The subscription is reinstated when the queue manager is restarted. |
|||
|
Message Count |
The number of messages put to the destination that are specified by this subscription. |
|||
|
Resume Date |
The date of the most recent MQSUB API call that connected to this subscription. |
|||
|
Subscription User |
The user ID that owns the subscription.
|
|||
|
Last Update |
The date and time of the last data update. |
|||