IBM MQ Topics View
This View allows you to view performance and utilization metrics for all of your IBM MQ topics. Clicking IBM MQ Topics in the left menu opens the IBM MQ Topics Table display, which allows you to view current alert status and performance metrics of all topics on a specific MQ broker in a table format. Other displays available in this View are:
| • | IBM MQ Topics Heatmap: Clicking MQ Topics Heatmap in the left/navigation menu opens this display, which allows you to view current alert status and performance metrics of all topics on a specific MQ broker in a heatmap format. |
| • | IBM Topic Summary: Clicking MQ Topic Summary in the left/navigation menu opens this display, which allows you to view current alert status and performance metrics for a specific topic on a specific MQ broker. |
IBM MQ Topics Table
This display allows you to view current alert status and performance metrics of all topics on a specific MQ broker in a table format.
Each row in the table contains data for a particular topic. You can search, filter, sort and choose columns to include by clicking a column header icon (to the right of each column label) and selecting Filter, Sort Ascending, Sort Descending or Columns.
You can also click any column header to sort and compare the values that interest you. Right-click on a table cell to Export to Excel or Copy Cell Value.
Investigate a topic by double-clicking a row, which opens the IBM Topic Summary display.
|
Filter By: |
||||
|
|
MQ Broker: |
Select the MQ broker for which you want to view data. |
||
|
Topics |
The number of topics found on the broker and listed in the table. |
|||
|
All Topics Table |
||||
|
|
Broker |
The name of the broker. |
||
|
|
Topic String |
The name of the topic. |
||
|
|
Alert Level |
The current alert severity.
|
||
|
|
Alert Count |
The total number of critical and warning alerts. |
||
|
|
Publish Count |
The number of messages sent by publishers to the topic on the broker. |
||
|
|
Subscription Count |
The number of messages received by subscribers from the topic on the broker. |
||
|
|
Admin Topic Name |
The name of the topic object. |
||
|
|
Cluster Name |
The cluster that is to be used for the propagation of publications and subscription to publish/subscribe cluster-connected queue managers for this topic. |
||
|
|
Cluster Pub Route |
The routing behavior used for the topic. |
||
|
|
Comm Info Name |
The name of the communication information object. |
||
|
|
Default Persistence |
The setting for default persistence (either PERSISTENT or NOT PERSISTENT). |
||
|
|
Default Priority |
The resolved default priority of messages published to the topic. |
||
|
|
Default Put Response Type |
The default put response (synchronous or asynchronous). |
||
|
|
Durable Subscriptions |
Displays whether or not the applications are permitted to make durable subscriptions to the topic. |
||
|
|
Inhibit Publications |
Displays whether publications are allowed for the topic. |
||
|
|
Inhibit Subscriptions |
Displays whether subscriptions are allowed for the topic. |
||
|
|
Model Durable Queue |
The name of the model queue used for managed durable subscriptions. |
||
|
|
Model Non Durable Queue |
The name of the model queue used for managed non-durable subscriptions. |
||
|
|
Multicast |
Displays whether multicast is used for the topic. |
||
|
|
NPM Delivery |
Lists the delivery mechanism for non-persistent messages published to this topic (ALL, ALL_DUR, and ALL_AVAIL). |
||
|
|
PM Delivery |
Lists the delivery mechanism for persistent messages published to this topic (ALL, ALL_DUR, and ALL_AVAIL). |
||
|
|
Publication Scope |
Lists whether this queue manager propagates subscriptions for this topic to queue managers as part of hierarchy or as part of publish cluster. |
||
|
|
Retained Publication |
Lists whether there is a retained publication for this topic. |
||
|
|
Subscription Scope |
Lists whether this queue manager propagates subscriptions for this topic to queue managers as part of hierarchy or as part of subscribe cluster. |
||
|
|
Use Dead letter Queue |
Lists whether the dead-letter queue is used when publication messages cannot be delivered to their correct subscriber queue. |
||
|
|
Expired |
When checked, performance data has not been received in the time specified in the Duration region on the RTView Configuration Application > Solution Package Configuration > IBM MQ > DATA STORAGE tab. |
||
|
|
Timestamp |
The date and time of the last data update. |
||


IBM MQ Topics Heatmap
This display allows you to view current alert status and performance metrics of all topics on a specific MQ broker in a heatmap format.
Use the Metric drop-down menu to view the heatmap based on Alert Severity, Alert Count, Publish Count, and Subscription Count.
Each rectangle in the heatmap represents a different topic, where the rectangle color indicates the most critical alert state for items associated with that topic.
By default, the Alert Severity metric is shown. Values range from 0 - 2, as indicated in the color gradient  bar:
bar:
 (2) Red indicates that one or more metrics exceeded their ALARM LEVEL threshold.
 (1) Yellow indicates that one or more metrics exceeded their WARNING LEVEL threshold.
 (0) Green indicates that no metrics have exceeded their alert thresholds.
Investigate a topic by clicking a rectangle which opens the IBM Topic Summary display.
Mouse-over rectangles to view more details about host performance and status. Toggle between the commonly accessed Table and Heatmap displays by clicking the drop down list on the display title.
|
Filter By: |
||||
|
|
Broker: |
Select the MQ broker for which you want to view data. |
||
|
Fields and Data |
||||
|
|
Topics |
Displays the number of topics found by the filter and listed in the heatmap. |
||
|
|
Show Broker |
Select this check box to display the names of the broker at the top of each rectangle in the heatmap. |
||
|
Heatmap |
||||
|
|
Log Scale |
Select this check box to enable a logarithmic scale. Use Log Scale to see usage correlations for data with a wide range of values. For example, if a minority of your data is on a scale of tens, and a majority of your data is on a scale of thousands, the minority of your data is typically not visible in non-log scale graphs. Log Scale makes data on both scales visible by applying logarithmic values rather than actual values to the data. |
||
|
|
Auto Scale |
Select to enable auto-scaling. When auto-scaling is activated, the color gradient bar's maximum range displays the highest value. Note: Some metrics auto-scale automatically, even when Auto Scale is not selected. |
||
|
|
Metric |
Choose a metric to view in the display. For details about the data, refer to vendor documentation. |
||
|
|
|
Alert Severity |
The current alert severity for items associated with the rectangle. Values range from 0 - 2, as indicated in the color gradient
|
|
|
|
|
Alert Count |
The total number of critical and warning unacknowledged alerts for items associated with the rectangle. The color gradient |
|
|
|
|
Publish Count |
The number of messages sent by publishers to the topic for items associated with the rectangle. The color gradient |
|
|
|
|
Subscription Count |
The number of messages received by subscribers from a topic for items associated with the rectangle. The color gradient |
|


 bar, populated by the current heatmap, shows the value/color mapping. The numerical values in the gradient bar range from 0 to the maximum number of published topics in the heatmap. The middle value in the gradient bar indicates the middle value of the range.
 bar, populated by the current heatmap, shows the value/color mapping. The numerical values in the gradient bar range from 0 to the maximum number of subscriptions in the heatmap. The middle value in the gradient bar indicates the middle value of the range.
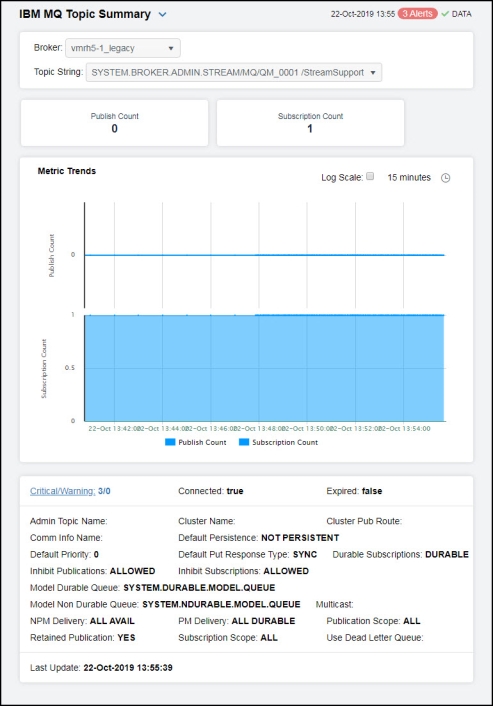
IBM Topic Summary
This display allows you to view current alert status and performance metrics for a specific topic on a specific MQ broker. Select a broker and a topic string from the drop-down menus to view data for the selected topic string. Clicking on the information boxes at the top of the display (such as Publish Count and Subscription Count) opens the IBM MQ Topics Table display, where you can sort and compare the performance values of all topics.
The trend graph traces the Metric Trends (Publish Count and Subscription Count) for the selected topic. You can specify the time range for the trend graph and view data based on a log scale, which enables visualization on a logarithmic scale and should be used when the range in your data is very broad.
You can also click any column header to sort and compare the values that interest you. Right-click on a table cell to Export to Excel or Copy Cell Value.
Clicking the Critical/Warning link at the bottom of the display opens the Alerts Table by Component display. You can hover over the trend graph to see the values at a particular time.
|
Filter By: |
||||
|
|
Broker: |
Select the MQ broker for which you want to view data. |
||
|
|
Topic String |
Select the topic for which you want to view data. |
||
|
Metric Trends Graph |
Traces the following for the selected topic: Publish Count: Traces the number of messages sent by publishers to the topic on the broker. Subscription Count: Traces the number of messages received by subscribers from the topic on the broker. |
|||
|
|
|
Log Scale |
Select to enable a logarithmic scale. Use Log Scale to see usage correlations for data with a wide range of values. For example, if a minority of your data is on a scale of tens, and a majority of your data is on a scale of thousands, the minority of your data is typically not visible in non-log scale graphs. Log Scale makes data on both scales visible by applying logarithmic values rather than actual values to the data. |
|
|
|
|
Time Settings |
Select a time range from the drop down menu varying from 5 Minutes to Last 7 Days. By default, the time range end point is the current time.
To change the time range, deselect the now toggle, which displays some additional date fields. You can click the left and right arrow buttons to decrease the end time by one time period (the time selected in the Time range drop down) per click, or you can choose the date and time from the associated calendar and clock icons. You can also enter the date and time in the text field using the following format: MMM dd, YYYY HH:MM:ss. For example, Aug 21, 2018 12:24 PM. Click the now toggle to reset the time range end point to the current time.
|
|
|
Critical/Warning |
The total number of critical and warning alerts. |
|||
|
Connected |
When checked, denotes that the broker is connected. |
|||
|
Expired |
When checked, performance data has not been received in the time specified in the Duration region on the RTView Configuration Application > Solution Package Configuration > IBM MQ > DATA STORAGE tab. |
|||
|
Admin Topic Name |
The name of the topic object. |
|||
|
Comm Info Name |
The name of the communication information object. |
|||
|
Default Priority |
The resolved default priority of messages published to the topic. |
|||
|
Durable Subscriptions |
Displays whether or not the applications are permitted to make durable subscriptions to the topic. |
|||
|
Model Durable Queue |
The name of the model queue used for managed durable subscriptions. |
|||
|
Model Non Durable Queue |
The name of the model queue used for managed non-durable subscriptions. |
|||
|
NPM Delivery |
Lists the delivery mechanism for non-persistent messages published to this topic (ALL, ALL_DUR, and ALL_AVAIL). |
|||
|
Retained Publication |
Lists whether there is a retained publication for this topic. |
|||
|
Cluster Name |
The cluster that is to be used for the propagation of publications and subscription to publish/subscribe cluster-connected queue managers for this topic. |
|||
|
Default Persistence |
The setting for default persistence (either PERSISTENT or NOT PERSISTENT). |
|||
|
Default Put Response Type |
The default put response (synchronous or asynchronous). |
|||
|
Inhibit Publications |
Displays whether publications are allowed for the topic. |
|||
|
PM Delivery |
Lists the delivery mechanism for persistent messages published to this topic (ALL, ALL_DUR, and ALL_AVAIL). |
|||
|
Subscription Scope |
Lists whether this queue manager propagates subscriptions for this topic to queue managers as part of hierarchy or as part of subscribe cluster. |
|||
|
Cluster Pub Route |
The routing behavior used for the topic. |
|||
|
Inhibit Subscriptions |
Displays whether subscriptions are allowed for the topic. |
|||
|
Multicast |
Displays whether multicast is used for the topic. |
|||
|
Publication Scope |
Lists whether this queue manager propagates published messages for this topic to queue managers as part of hierarchy or as part of publish cluster. |
|||
|
Use Dead Letter Queue |
Lists whether the dead-letter queue is used when publication messages cannot be delivered to their correct subscriber queue. |
|||
|
Last Update |
The date and time of the last data update. |
|||