Docker Engines View
These displays provide detailed data for all engines or for a particular engine. Clicking Docker Engines from the left/navigation menu opens the Docker Engines Table display, which shows a tabular view of all engines and their associated metrics. The options available under Docker Engines are:
| • | All Engines Heatmap: Opens the Docker Engines Heatmap display, which provides a heatmap view of all engines and their associated metrics. |
| • | Single Engine Summary: Opens the Docker Single Engine Summary display, which provides additional details and a way to view trending data for a single engine. |
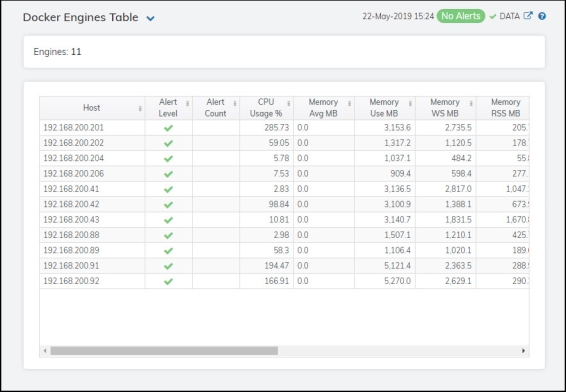
Docker Engines Table
This table provides a view of all of your engines and their associated metric data including host, alert severity, alert count, and the current value of each gathered metric. Each row in the table contains data for a particular engine. Click a column header to sort column data in ascending or descending order. Double-click on a table row to drill-down to the Docker Single Engine Summary display and view metrics for that particular engine. Toggle between the commonly accessed displays by clicking the drop down list on the display title.
|
Fields and Data: |
||||
|
|
Engines |
The total number of engines being monitored and listed in the table. |
||
|
All Engines Table: |
||||
|
|
Host |
The name of the host. |
||
|
|
Alert Level |
The current alert severity.
|
||
|
|
Alert Count |
The total number of alerts for the host. |
||
|
|
CPU Usage % |
The percentage of CPU used by the engine. |
||
|
|
Memory Avg MB |
The average amount of memory, in megabytes, that is available to the engine. |
||
|
|
Memory Use MB |
The current memory usage by the engine, in megabytes, which includes all memory regardless of when it was accessed. |
||
|
|
Memory WS MB |
The amount of memory (in megabytes) in the working set, which includes recently accessed memory, dirty memory, and kernel memory. |
||
|
|
Memory RSS MB |
The amount of anonymous and swap cache memory (including transparent/hugepages), in megabytes. |
||
|
|
Memory Fails |
The number of times when enough memory has not been available. |
||
|
|
Net Bytes In Avg |
The average number of incoming bytes per second. |
||
|
|
Net Bytes Out Avg |
The average number of outgoing bytes per second. |
||
|
|
Net Packets In Avg |
The average number of incoming packets per second. |
||
|
|
Net Packets Out Avg |
The average number of outgoing packets per second. |
||
|
|
Expired |
When checked, performance data has not been received within the time specified (in seconds) in the Expire Time field in the Duration region in the RTView Configuration Application > (Project Name) > Solution Package Configuration > Docker > DATA STORAGE tab. The Delete Time field (also in the Duration region) allows you to define the amount of time (in seconds) in which the row will be removed from the table if there is no response. |
||
|
|
Time Stamp |
The date and time the row data was last updated. |
||


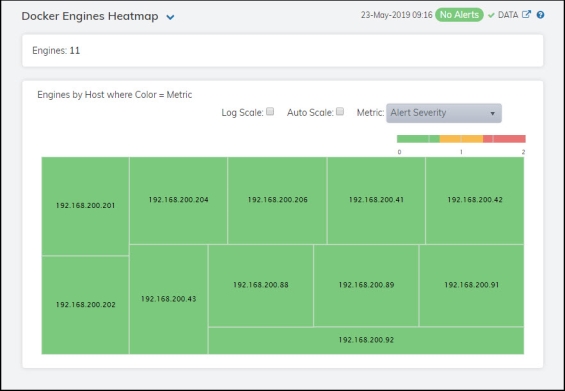
Docker Engines Heatmap
Clicking All Engines Heatmap in the left/navigation menu opens the Docker Engines Heatmap, which provides an easy-to-view interface that allows you to quickly identify the current status of each of your engines for each available metric. You can view the engines in the heatmap based on the following metrics: the current alert severity, the current alert count, the percentage of CPU used, the amount of memory used, the total incoming bytes, and the total outgoing bytes. By default, this display shows the heatmap based on the Alert Severity metric.
Each rectangle in the heatmap represents an engine. The rectangle color indicates the most critical alert state associated with the engine. Choose a different metric to display from the Metric drop-down menu. Mouse over a rectangle to see additional metrics. By default, this display shows Alert Severity.
Drill-down and investigate an engine by clicking a rectangle in the heatmap to view details in the Docker Single Engine Summary display.
|
Fields and Data: |
||||
|
|
Engines |
Lists the total number of engines found using the search parameters. |
||
|
Heatmap |
||||
|
|
Log Scale |
Select this check box to enable a logarithmic scale. Use Log Scale to see usage correlations for data with a wide range of values. For example, if a minority of your data is on a scale of tens, and a majority of your data is on a scale of thousands, the minority of your data is typically not visible in non-log scale graphs. Log Scale makes data on both scales visible by applying logarithmic values rather than actual values to the data. |
||
|
|
Auto Scale |
Select to enable auto-scaling. When auto-scaling is activated, the color gradient bar's maximum range displays the highest value. Note: Some metrics auto-scale automatically, even when Auto Scale is not selected. |
||
|
|
Metric |
Select the metric driving the heatmap display. The default is Alert Severity. Each Metric has a color gradient bar that maps values to colors. The heatmap organizes the servers by host, where each rectangle represents an engine. Mouse-over any rectangle to display the current values of the metrics for the engine. Click on a rectangle to drill-down to the associated Docker Single Engine Summary display for a detailed view of metrics for that particular engine. |
||
|
|
|
Alert Severity |
The current alert severity. Values range from 0 - 2, as indicated in the color gradient
|
|
|
|
|
Alert Count |
The total number of critical and warning unacknowledged alerts in the engine. The color gradient |
|
|
|
|
CPU Usage |
The percentage of CPU used by the engine. The color gradient When Auto Scale is checked, the numeric values in the color gradient bar show the range of the data being displayed rather than the default values. The middle value changes accordingly to indicate the color of the middle value of the range. |
|
|
|
|
Memory Usage MB |
The current memory usage by the engine, in megabytes, which includes all memory regardless of when it was accessed. The color gradient bar The Auto Scale option does not impact this metric. |
|
|
|
|
Net Inbound Avg KB |
The average number of incoming kilobytes. The color gradient When Auto Scale is checked, the numeric values in the color gradient bar show the range of the data being displayed rather than the default values. The middle value changes accordingly to indicate the color of the middle value of the range. |
|
|
|
|
Net Outbound Avg KB |
The average number of outgoing kilobytes.The color gradient When Auto Scale is checked, the numeric values in the color gradient bar show the range of the data being displayed rather than the default values. The middle value changes accordingly to indicate the color of the middle value of the range. |
|


 shows the range of the value/color mapping. The numerical values in the gradient bar range from

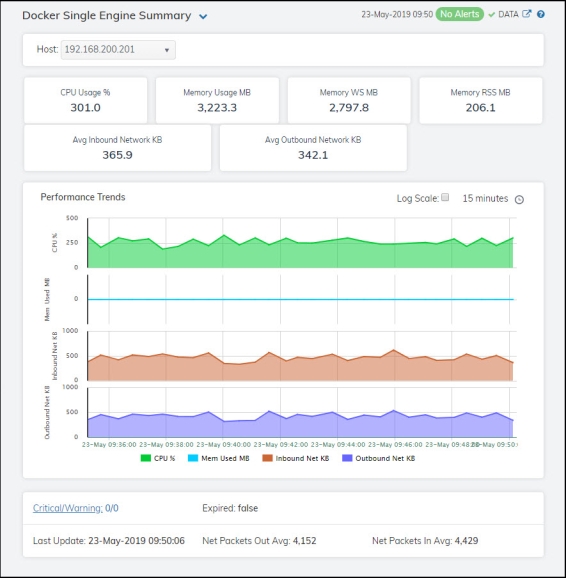
Docker Single Engine Summary
Clicking Single Engine Summary in the left/navigation menu opens the Docker Single Engine Summary display, which allows you to view current as well as trending data for the percentage of CPU used by the engine, memory usage details, and network data details. Clicking on the information boxes at the top of the display takes you to the Docker Engines Table display, where you can view additional engines data.
The Performance Trends trend graph allows you to view trend data for the CPU percentage, memory used, inbound net kilobytes, and outbound net kilobytes over a selected time range.
Clicking the Critical/Warning link at the bottom of the display opens the Alerts Table by Component display.
|
Filter By: |
||||
|
|
Host |
Select the host for which you want to show data in the display. |
||
|
Fields and Data: |
||||
|
|
CPU Usage % |
The percentage of CPU used by the engine. |
||
|
|
Memory Usage MB |
The current memory usage by the engine, in megabytes, which includes all memory regardless of when it was accessed. |
||
|
|
Memory WS MB |
The amount of memory (in megabytes) in the working set, which includes recently accessed memory, dirty memory, and kernel memory. |
||
|
|
Memory RSS MB |
The Resident Set Size, which is the amount of anonymous and swap cache memory (including transparent/hugepages), in kilobytes. |
||
|
|
Avg Inbound Network KB |
The average number of incoming kilobytes. |
||
|
|
Avg Outbound Network KB |
The average number of outbound kilobytes. |
||
|
Performance Trends Graph |
Traces the following: CPU % -- traces the percentage of CPU being used on the engine. Mem Used MB -- traces the amount of memory, in megabytes, used by the engine. Inbound Net KB -- traces the average number of incoming kilobytes per second. Outbound Net KB -- traces the average number of outgoing kilobytes per second. |
|||
|
|
|
Log Scale |
Select to enable a logarithmic scale. Use Log Scale to see usage correlations for data with a wide range of values. For example, if a minority of your data is on a scale of tens, and a majority of your data is on a scale of thousands, the minority of your data is typically not visible in non-log scale graphs. Log Scale makes data on both scales visible by applying logarithmic values rather than actual values to the data. |
|
|
|
|
Time Settings |
Select a time range from the drop down menu varying from 5 Minutes to Last 7 Days. By default, the time range end point is the current time.
To change the time range, deselect the now toggle, which displays some additional date fields. You can click the left and right arrow buttons to decrease the end time by one time period (the time selected in the Time range drop down) per click, or you can choose the date and time from the associated calendar and clock icons. You can also enter the date and time in the text field using the following format: MMM dd, YYYY HH:MM:ss. For example, Aug 21, 2018 12:24 PM. Click the now toggle to reset the time range end point to the current time.
|
|
|
Critical/Warning |
The number of critical and warning alerts. |
|||
|
Expired |
When checked, performance data has not been received within the time specified (in seconds) in the Expire Time field in the Duration region in the RTView Configuration Application > (Project Name) > Solution Package Configuration > Docker > DATA STORAGE tab. The Delete Time field (also in the Duration region) allows you to define the amount of time (in seconds) in which the row will be removed from the table if there is no response. |
|||
|
Last Update |
The date and time of the last data update. |
|||
|
Net Packets In Avg |
The average number of incoming packets. |
|||
|
Net Packets Out Avg |
The average number of outgoing packets. |
|||