WebLogic Applications View
These displays present several views of performance metrics for applications on clusters and a particular WebLogic server. Clicking WebLogic Applications from the left menu opens the WebLogic Cluster Applications Table display, which enables you to track utilization and performance metrics for all clusters on a particular domain, or on all domains.
| • | Cluster App Summary: Opens the WebLogic Clustered Application Summary display, which allows you to view performance and utilization metrics for all applications on a particular cluster, or for all applications on all clusters. |
| • | All Apps Heatmap: Opens the WebLogic Server Applications Heatmap display, which shows a heatmap view of the status and alerts of all applications within a specific WebLogic server. |
| • | All Apps Summary: Opens the WebLogic Server Applications Summary display, which allows you to track performance, utilization, and trend data for all applications on a single WebLogic server. |
| • | Application Summary: Opens the WebLogic Application Summary display, which allows you to view performance, utilization, and trend data for a single application component on a single WebLogic server. |
| • | Application Trends: Opens the WebLogic Application Metric Trends display, which allows you to view trend data for a single application on a particular WebLogic server. |
| • | App Components Heatmap: Opens the WebLogic Application Components Heatmap display, which provides a heatmap view of the status and alerts of all application components contained within each application on a particular WebLogic server. |
| • | App Component Summary: Opens the WebLogic Application Component Summary display, which allows you to view performance, utilization, and trend data for a particular application component on a WebLogic Server. |
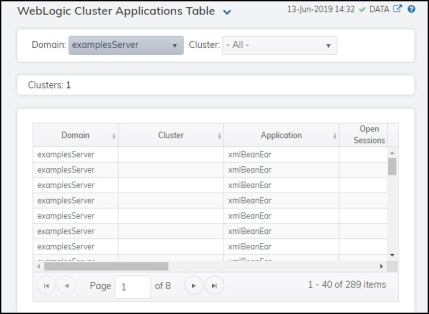
WebLogic Cluster Applications Table
Clicking WebLogic Applications in the left/navigation menu opens the WebLogic Cluster Applications Table display, which allows you to view performance and utilization metrics for all applications on a particular cluster, or for all applications on all clusters. Double-clicking on a row in the table opens the WebLogic Clustered Application Summary display, which allows you to view additional information for that particular application.
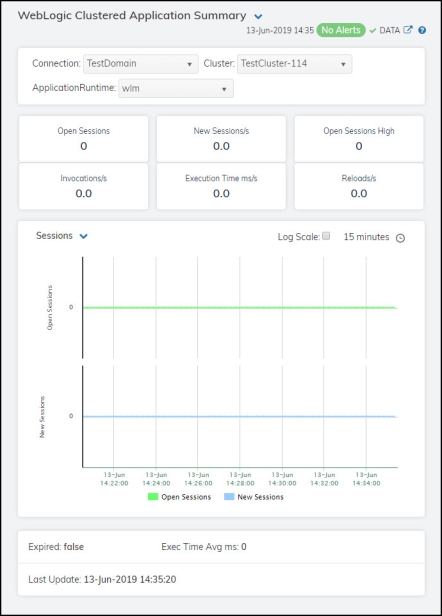
WebLogic Clustered Application Summary
Clicking Cluster App Summary in the left/navigation menu opens the WebLogic Clustered Application Summary display, which allows you to view session information for a particular application. Hovering over the information boxes at the top of the display provides additional details, and clicking on them takes you to the WebLogic Servers Table display, where you can view additional data.
There are two options in the trend graph region: Sessions and Rates. Selecting Sessions traces the number of open sessions and the number of newly created sessions over a defined time range. Selecting Rates traces the number of sessions created per second, the number of invocations per second, and the execution time in milliseconds per second over a defined time range.
Note: Fields with an asterisk (*) at the end of the field definition contain data that is provided by the WebLogic Server MBean interface. Refer to WebLogic documentation for more information regarding these fields.
|
Fields and Data |
|||
|
|
Connection |
Select the connection containing the cluster for which you want to view data. |
|
|
|
Cluster |
Select the cluster for which you want to view data. |
|
|
|
Application Runtime |
Select the application for which you want to view data. |
|
|
Fields and Data |
|||
|
|
Open Sessions |
Displays the number of open sessions.* |
|
|
|
New Sessions/s |
The number of new sessions being created per second. |
|
|
|
Open Sessions High |
The highest number of open sessions. |
|
|
|
Invocations/s |
The number of invocations per second being created. |
|
|
|
Execution Time ms/s |
The total amount of execution time, in milliseconds per second. |
|
|
|
Reloads/s |
The number of reloads per second. |
|
|
Trend Graph |
Sessions Open Sessions -- Traces the number of open sessions. Recent New -- Traces the number of newly created sessions. Rates New Sessions/s -- Traces the number of sessions created per second. Invocations/s -- Traces the number of invocations per second. Exec Time ms/s -- Traces the execution time in milliseconds per second. |
||
|
|
|
Log Scale |
This option should be used when the range of your data is very broad. When checked, the values are displayed using a logarithmic scale rather than using the actual values so that data on the extreme ends of the scale can be viewed more effectively. For example, if you have data that ranges from the tens to the thousands, the data in the range of the tens will be neglected visually if you do not check this option.
|
|
|
|
Time Settings |
Select a time range from the drop down menu varying from 5 Minutes to Last 7 Days. By default, the time range end point is the current time.
To change the time range, deselect the now toggle, which displays some additional date fields. You can click the left and right arrow buttons to decrease the end time by one time period (the time selected in the Time range drop down) per click, or you can choose the date and time from the associated calendar and clock icons. You can also enter the date and time in the text field using the following format: MMM dd, YYYY HH:MM:ss. For example, Aug 21, 2018 12:24 PM. Click the now toggle to reset the time range end point to the current time.
|
|
Expired |
This check box becomes automatically checked when the data displayed in the row has exceeded the specified cache expiration time (set by default at 45 seconds) and is no longer current. Once the cache has been refreshed and is displaying current data, the check box will return to being unchecked. This check box will remain unchecked as long as the cache has been refreshed within the specified cache expiration time and the data is current. |
||
|
Exec Time Avg ms |
Displays the average execution time, in milliseconds, on the application.* |
||
|
Last Update |
The date and time of the last data update. |
||

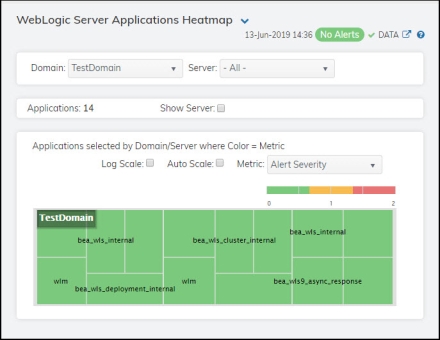
WebLogic Server Applications Heatmap
Clicking All Apps Heatmap in the left/navigation menu opens the WebLogic Servers Applications Heatmap display, which provides a heatmap view of the status and alerts of all applications within a specific WebLogic server. You can view the servers in the heatmap based on the following metrics: alert severity, alert count, total open sessions, open sessions rate, total invocations, invocations rate, execution time, or total reloads.
The heatmap is organized by domain, where each rectangle represents an application. The rectangle color indicates the most critical alert state. Click on a node to drill-down to the WebLogic Server Applications Summary display and view metrics for all applications associated with that server. You can toggle between the commonly accessed displays by clicking the display title’s drop down list. Mouse-over rectangles to view more details about connection performance and status.
|
Filter By: |
|||
|
|
Domain |
Select the domain containing the WebLogic Server for which you want to view data. |
|
|
|
Server |
Select the WebLogic server for which you want to view data. |
|
|
Applications |
The total number of applications on the server. |
||
|
Show Server |
Select this check box to display the server name in each rectangle in the heatmap. |
||
|
Heatmap |
|||
|
|
Log Scale |
This option enables visualization on a logarithmic scale, and should be used when the range in your data is very broad. For example, if you have data that ranges from the tens to the thousands, then data in the range of tens will be neglected visually if you do not check this option. This option makes data on both extreme ranges visible by using the logarithmic of the values rather than the actual values.
|
|
|
|
Auto Scale |
Select to enable auto-scaling. When auto-scaling is activated, the color gradient bar's maximum range displays the highest value. Note: Some metrics auto-scale automatically, even when Auto Scale is not selected. |
|
|
|
Metric |
Select the metric driving the heatmap display. The default is Alert Severity. Each Metric has a color gradient bar that maps values to colors. The heatmap organizes the instances by domain, where each rectangle represents an application. Mouse-over any rectangle to display the current values of the metrics for the application. Click on a rectangle to drill-down to the associated WebLogic Server Applications Summary display for a detailed view of metrics for that particular server. |
|
|
|
|
Alert Severity |
The maximum alert level in the item (index) associated with the rectangle. Values range from 0 to 2, as indicated in the color gradient bar 2 -- Metrics that have exceeded their specified ALARMLEVEL threshold and have an Alert Severity value of 2 are shown in red. For a given rectangle, this indicates that one or more metrics have exceeded their alarm threshold. 1 -- Metrics that have exceeded their specified WARNINGLEVEL threshold and have an Alert Severity value of 1 are shown in yellow. For a given rectangle, this indicates that one or more metrics have exceeded their warning threshold. 0 -- Metrics that have not exceeded either specified threshold have an Alert Severity value of 0 and are shown in green. For a given rectangle, this indicates that no metrics have exceeded a specified alert threshold. |
|
|
|
Alert Count |
The total number of alarm and warning alerts in a given item (index) associated with the rectangle. The color gradient bar |
|
|
|
Open Sessions |
The total number of open sessions in a given item (index) associated with the rectangle. The color gradient bar |
|
|
|
Open Sessions/s |
The number of sessions opened per second in a given item (index) associated with the rectangle. The color gradient bar |
|
|
|
Invocations/s |
The number of invocations per second in a given item (index) associated with the rectangle. The color gradient bar |
|
|
|
Invocations |
The total number of invocations in a given item (index) associated with the rectangle. The color gradient bar |
|
|
|
Execution Time ms |
The execution time, in milliseconds, in a given item (index) associated with the rectangle. The color gradient bar |
|
|
|
Reloads |
The total reload count in a given item (index) associated with the rectangle. The color gradient bar |
 , where
  shows the range of the value/color mapping. The numerical values in the gradient bar range from
  shows the range of the value/color mapping. By default, the numerical values in the gradient bar range from
  shows the range of the value/color mapping. The numerical values in the gradient bar range from
  shows the range of the value/color mapping. The numerical values in the gradient bar range from
  shows the range of the value/color mapping. The numerical values in the gradient bar range from
  shows the range of the value/color mapping. The numerical values in the gradient bar range from
  shows the range of the value/color mapping. The numerical values in the gradient bar range from
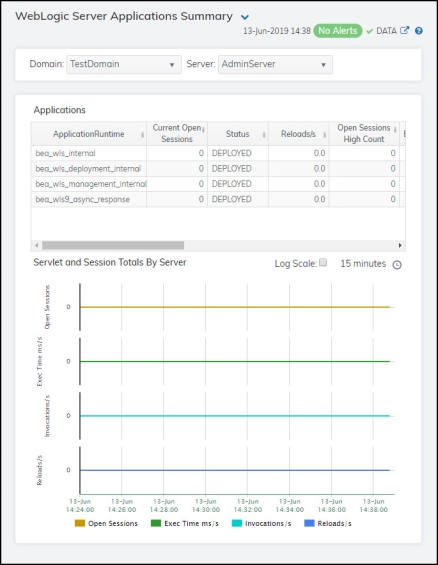
WebLogic Server Applications Summary
Clicking All Apps Summary in the left/navigation menu opens the WebLogic Server Applications Summary display, which allows you to track performance, utilization, and trend data for all applications on a single WebLogic server. This display is broken up into a table listing all applications on the selected server and a Servlet and Session Totals By Server trend graph that traces open sessions, execution time, invocation creation rate, and reloads creation rate for the selected server over a defined time range. Clicking a row in the table opens the WebLogic Application Summary display, where you can view additional data for the selected application.
Note: Fields with an asterisk (*) at the end of the field definition contain data that is provided by the WebLogic Server MBean interface. Refer to WebLogic documentation for more information regarding these fields.
|
Filter By: |
|||
|
|
Domain |
Select the domain containing the WebLogic Server for which you want to view data. |
|
|
|
Server |
Select the WebLogic server for which you want to view data. |
|
|
Applications Table |
|||
|
|
|
Application Runtime |
The name of the application. |
|
|
|
Current Open Sessions |
The number of open sessions. |
|
|
|
Status |
The status of the application. |
|
|
|
Reloads / sec |
The rate of reloads (per second). |
|
|
|
Open Sessions High Count |
The highest number of sessions opened at one time. |
|
|
|
Exec Time ms/s |
The rate of execution time in milliseconds per second. |
|
|
|
Invocations |
The number of invocations. |
|
|
|
Open Sessions |
The number of currently open sessions. |
|
|
|
Deployment State |
The current status of the application’s deployment. |
|
|
|
Sessions Opened Total Count |
The total number of opened sessions. |
|
|
|
Invocations/s |
The number of invocations per second.
|
|
|
|
Reloads |
The number of reloads. |
|
|
|
Expired |
Set to true when the data displayed in the row has exceeded the specified cache expiration time (set by default at 45 seconds) and is no longer current. Once the cache has been refreshed and is displaying current data, this column will be set to false. This setting will remain false as long as the cache has been refreshed within the specified cache expiration time and the data is current. |
|
|
|
time_stamp |
The date and time this row of data was last updated. |
|
Servlet and Session Totals By Server |
Shows the following: Open Sessions -- Traces the total number of open sessions in the application. Exec Time ms/s -- Traces the execution time per second in the application. Invocations/s -- Traces the number of invocations per second. Reloads/s -- Traces the number of reloads per second. |
||
|
|
|
Log Scale |
This option should be used when the range of your data is very broad. When checked, the values are displayed using a logarithmic scale rather than using the actual values so that data on the extreme ends of the scale can be viewed more effectively. For example, if you have data that ranges from the tens to the thousands, the data in the range of the tens will be neglected visually if you do not check this option.
|
|
|
|
Time Settings |
Select a time range from the drop down menu varying from 5 Minutes to Last 7 Days. By default, the time range end point is the current time.
To change the time range, deselect the now toggle, which displays some additional date fields. You can click the left and right arrow buttons to decrease the end time by one time period (the time selected in the Time range drop down) per click, or you can choose the date and time from the associated calendar and clock icons. You can also enter the date and time in the text field using the following format: MMM dd, YYYY HH:MM:ss. For example, Aug 21, 2018 12:24 PM. Click the now toggle to reset the time range end point to the current time.
|

WebLogic Application Summary
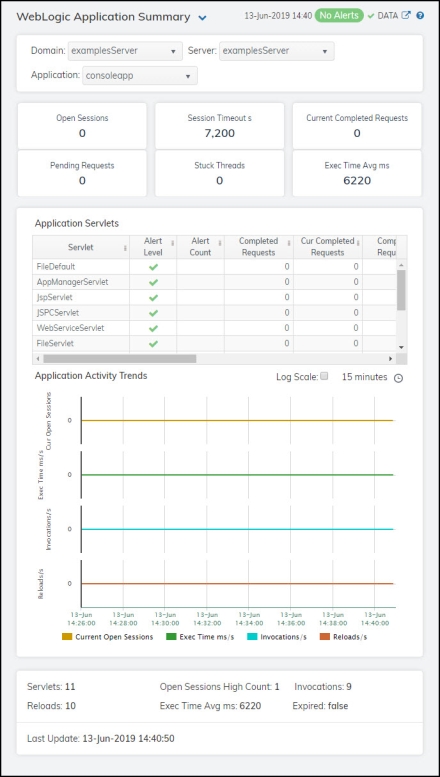
Clicking Application Summary in the left/navigation menu opens the WebLogic Application Summary display, which allows you to view performance, utilization, and trend data for a single application on a single WebLogic server. Hovering over the information boxes at the top of the display provides additional details.
The Application Servlets table lists all associated servlets and their various metrics. Double-clicking on a row in this table opens the WebLogic Server Applications Summary display where you can view additional details.
The Application Activity Trends trend graph traces the current number of open sessions, the execution time rate (in milliseconds/second), the invocation creation rate, and the reloads rate over a defined time range.
|
Filter By |
|||
|
|
Domain |
Select the domain for which you want to view data. |
|
|
|
Server |
Select the WebLogic server for which you want to view data. |
|
|
|
Application |
Select the application for which you want to view data. |
|
|
Open Sessions |
The number of open sessions on the server. |
||
|
Session Timeout s |
The rate of session timeouts, per second. |
||
|
Current Completed Requests |
The increase in the amount of completed requests (from the previous polling period to the current polling period). |
||
|
Pending Requests |
The number of requests waiting in the queue.* |
||
|
Stuck Threads |
The number of threads that are “stuck.”* |
||
|
Exec Time Avg ms |
The average execution time, in milliseconds. |
||
|
Application Servlets |
|||
|
|
Servlet |
The name of the servlet. |
|
|
|
Alert Level |
The current alert level.
|
|
|
|
Alert Count |
The total number of alerts. |
|
|
|
Completed Requests |
The number of requests that have been completed.* |
|
|
|
Cur Completed Requests |
The increase in the amount of completed requests (from the previous polling period to the current polling period). |
|
|
|
Completed Requests/s |
The rate of completed requests (per second). |
|
|
|
Pending Requests |
The number of requests waiting in the queue.* |
|
|
|
Cur Pending Requests |
The increase in the amount of pending requests (from the previous polling period to the current polling period). |
|
|
|
Pending Requests/s |
The rate of pending requests (per second). |
|
|
|
Stuck Threads |
The number of threads that are “stuck.”* |
|
|
|
Cur Stuck Threads |
The increase in the amount of “stuck” threads (from the previous polling period to the current polling period). |
|
|
|
Stuck Threads/s |
The rate of threads becoming “stuck” (per second). |
|
|
Application Activity Trends Graph |
Shows the following: Current Open Sessions -- Traces the total number of open sessions in the application. Exec Time ms/s -- Traces the execution time, in milliseconds per second, in the application. Invocations/s -- Traces the number of invocations per second. Reloads/s -- Traces the number of reloads per second. |
||
|
|
|
Log Scale |
This option should be used when the range of your data is very broad. When checked, the values are displayed using a logarithmic scale rather than using the actual values so that data on the extreme ends of the scale can be viewed more effectively. For example, if you have data that ranges from the tens to the thousands, the data in the range of the tens will be neglected visually if you do not check this option.
|
|
|
|
Time Settings |
Select a time range from the drop down menu varying from 5 Minutes to Last 7 Days. By default, the time range end point is the current time.
To change the time range, deselect the now toggle, which displays some additional date fields. You can click the left and right arrow buttons to decrease the end time by one time period (the time selected in the Time range drop down) per click, or you can choose the date and time from the associated calendar and clock icons. You can also enter the date and time in the text field using the following format: MMM dd, YYYY HH:MM:ss. For example, Aug 21, 2018 12:24 PM. Click the now toggle to reset the time range end point to the current time.
|
|
Servlets |
The number of servlets. |
||
|
Reloads |
The number of reloads. |
||
|
Open Sessions |
The number of open sessions. |
||
|
Exec Time Avg ms |
The average execution time, in milliseconds. |
||
|
Invocations |
The number of invocations. |
||
|
Expired |
This check box becomes automatically checked when the data displayed in the row has exceeded the specified cache expiration time (set by default at 45 seconds) and is no longer current. Once the cache has been refreshed and is displaying current data, the check box will return to being unchecked. This check box will remain unchecked as long as the cache has been refreshed within the specified cache expiration time and the data is current. |
||
|
Last Update |
The date and time the data in the row was last updated. |
||


WebLogic Application Metric Trends
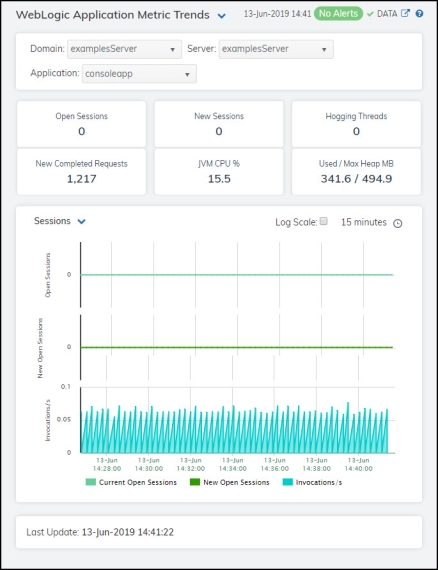
Clicking Application Trends in the left/navigation menu opens the WebLogic Application Metric Trends display, which allows you to view metrics and trend data for a single application on a particular WebLogic server. Hovering over the information boxes at the top of the display provides additional details.
The trend graph at the bottom of the display has three options: Sessions, Threads, and JVM. Sessions traces the current number of open sessions, the number of new open sessions, and the invocation rate over a defined time range. Threads traces the current number of thread requests and the number of hogging threads over a defined time range. JVM traces the JVM usage percentage, the maximum heap, and the used heap over a defined time range.
Note: Fields with an asterisk (*) at the end of the field definition contain data that is provided by the WebLogic Server MBean interface. Refer to WebLogic documentation for more information regarding these fields.
|
Filter By: |
|||
|
|
Domain |
Select the domain containing the WebLogic Server for which you want to view data. |
|
|
|
Server |
Select the WebLogic server containing the application for which you want to view data. |
|
|
|
Application |
Select the application for which you want to view data. |
|
|
Fields and Data |
|||
|
|
Open Sessions |
The total number of open sessions in the application. |
|
|
|
New Sessions |
The number of new sessions in the application. |
|
|
|
Hogging Threads |
The number of hogging threads in the application. |
|
|
|
New Completed Requests |
The number of new completed requests in the application. |
|
|
|
JVM CPU % |
The JVM CPU percentage in the application. |
|
|
|
Used/Max Heap MB |
The max heap used and the used heap, in megabytes, in the application. |
|
|
Trend Graphs |
Sessions Open Sessions -- Traces the total number of open sessions in the application. New Open Sessions -- Traces the number of new sessions in the application. Invocations/s -- Traces the number of invocations per second in the application. Threads Thread Requests -- Traces the number of thread requests in the application. Hogging Threads -- Traces the number of hogging threads in the application. JVM JVM CPU % -- Traces the JVM CPU percentage in the application. Max Heap MB -- Traces the max heap used, in megabytes, in the application. Used Heap MB -- Traces the used heap, in megabytes, in the application. |
||
|
|
|
Log Scale |
This option should be used when the range of your data is very broad. When checked, the values are displayed using a logarithmic scale rather than using the actual values so that data on the extreme ends of the scale can be viewed more effectively. For example, if you have data that ranges from the tens to the thousands, the data in the range of the tens will be neglected visually if you do not check this option.
|
|
|
|
Time Settings |
Select a time range from the drop down menu varying from 5 Minutes to Last 7 Days. By default, the time range end point is the current time.
To change the time range, deselect the now toggle, which displays some additional date fields. You can click the left and right arrow buttons to decrease the end time by one time period (the time selected in the Time range drop down) per click, or you can choose the date and time from the associated calendar and clock icons. You can also enter the date and time in the text field using the following format: MMM dd, YYYY HH:MM:ss. For example, Aug 21, 2018 12:24 PM. Click the now toggle to reset the time range end point to the current time.
|
|
Last Update |
The date and time of the last data update. |
||

WebLogic Application Components Heatmap
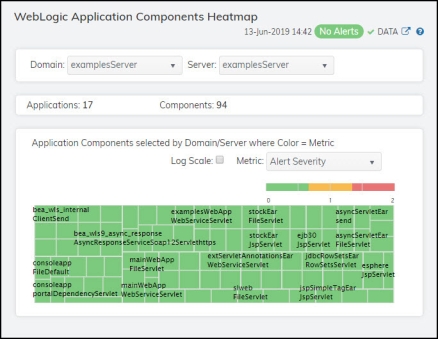
Clicking Apps Components Heatmap in the left/navigation menu opens the WebLogic Applications Components Heatmap display, which provides a heatmap view of the status and alerts of all application components contained within each application on a particular WebLogic server. You can view the applications in the heatmap based on the following metrics: alert severity, alert count, completed requests, completed requests rate, invocations rate, invocations, execution time, and reloads.
The heatmap is organized by domain/server, where each rectangle represents an application. The rectangle color indicates the most critical alert state. Click on a node to drill-down to the WebLogic Application Component Summary display and view metrics for the selected component. You can toggle between the commonly accessed displays by clicking the display title’s drop down list. Mouse-over rectangles to view more details about component performance and status.
|
Filter By: |
|||
|
|
Domain |
Select the domain containing the WebLogic Server for which you want to view data. |
|
|
|
Server |
Select the WebLogic server for which you want to view data. |
|
|
Applications |
Displays the total number of application components in the WebLogic server. |
||
|
Components |
Displays the total number of components in the WebLogic server. |
||
|
Heatmap |
|||
|
|
Log Scale |
This option enables visualization on a logarithmic scale, and should be used when the range in your data is very broad. For example, if you have data that ranges from the tens to the thousands, then data in the range of tens will be neglected visually if you do not check this option. This option makes data on both extreme ranges visible by using the logarithmic of the values rather than the actual values.
|
|
|
|
Metric |
Select the metric driving the heatmap display. The default is Alert Severity. Each Metric has a color gradient bar that maps values to colors. The heatmap organizes the collections by domain/server, where each rectangle represents an application. Mouse-over any rectangle to display the current values of the metrics for the application. Click on a rectangle to drill-down to the associated WebLogic Application Component Summary display for a detailed view of metrics for that particular application. |
|
|
|
|
Alert Severity |
The maximum alert level in the item (index) associated with the rectangle. Values range from 0 to 2, as indicated in the color gradient bar 2 -- Metrics that have exceeded their specified ALARMLEVEL threshold and have an Alert Severity value of 2 are shown in red. For a given rectangle, this indicates that one or more metrics have exceeded their alarm threshold. 1 -- Metrics that have exceeded their specified WARNINGLEVEL threshold and have an Alert Severity value of 1 are shown in yellow. For a given rectangle, this indicates that one or more metrics have exceeded their warning threshold. 0 -- Metrics that have not exceeded either specified threshold have an Alert Severity value of 0 and are shown in green. For a given rectangle, this indicates that no metrics have exceeded a specified alert threshold. |
|
|
|
Alert Count |
The total number of alarm and warning alerts in a given item (index) associated with the rectangle. The color gradient bar |
|
|
|
Completed Requests |
The number of completed requests in a given item (index) associated with the rectangle. The color gradient bar |
|
|
|
Completed Requests/s |
The number of completed requests per second in a given item (index) associated with the rectangle. The color gradient bar |
|
|
|
Invocations/s |
The number of invocations per second in a given item (index) associated with the rectangle. The color gradient bar |
|
|
|
Invocations |
The total number of invocations in a given item (index) associated with the rectangle. The color gradient bar |
|
|
|
Execution Time ms |
The total exection time in a given item (index) associated with the rectangle. The color gradient bar |
|
|
|
Reloads |
The total number of reloads in a given item (index) associated with the rectangle. The color gradient bar |
 , where
  shows the range of the value/color mapping. The numerical values in the gradient bar range from
  shows the range of the value/color mapping. The numerical values in the gradient bar range from
  shows the range of the value/color mapping. The numerical values in the gradient bar range from
  shows the range of the value/color mapping. The numerical values in the gradient bar range from
  shows the range of the value/color mapping. The numerical values in the gradient bar range from
  shows the range of the value/color mapping. The numerical values in the gradient bar range from
  shows the range of the value/color mapping. The numerical values in the gradient bar range from
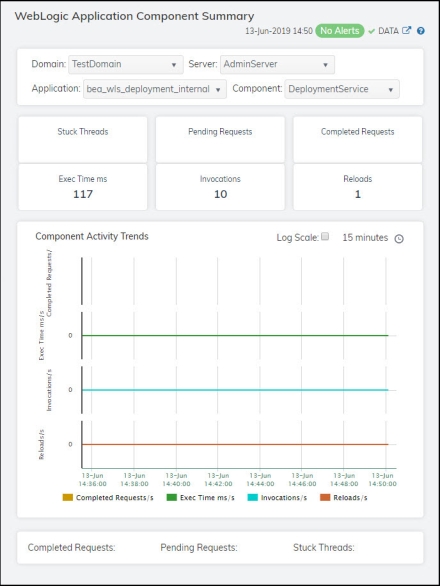
WebLogic Application Component Summary
Clicking App Component Summary in the left/navigation menu opens the WebLogic Application Component Summary display, which allows you to view performance, utilization, and trend data for a particular application component on a single WebLogic Server. Hovering over the information boxes at the top of the display provides additional details.
The Component Activity Trends trend graph at the bottom of the display traces the completed requests rate, the execution time rate, the invocation creation rate, and the number of reloads per second over a defined time range.
Note: Row columns in this table with an asterisk (*) at the end of the column definition contain data that is provided by the WebLogic Server MBean interface. Refer to WebLogic documentation for more information regarding these columns.
|
Filter By: |
|||
|
|
Domain |
Select the domain containing the WebLogic server for which you want to view data. |
|
|
|
Server |
Select the WebLogic server containing the application for which you want to view data. |
|
|
|
Application |
Select the application for which you want to view data. |
|
|
|
Component |
Select the component for which you want to view data. |
|
|
Fields and Data |
|||
|
|
Stuck Threads |
The number of stuck threads. |
|
|
|
Pending Requests |
The number of pending requests. |
|
|
|
Completed Requests |
The number of completed requests. |
|
|
|
Exec Time ms |
The amount of time (in milliseconds) it took to execute the last invocation.* |
|
|
|
Invocations |
The total number of invocations of the application or component.* |
|
|
|
Reloads |
The total number of times the WebLogic server has reloaded the component since it was last deployed.* |
|
|
|
Component Activity Trends Graph |
Shows message data for the selected collection. Completed Requests/s -- Traces the rate of completed requests in the application. Exec. Time ms/s -- Traces the rate of executions, in milliseconds per second, in the application. Invocations/s -- Traces the rate of invocations in the application. Reloads/s -- Traces the rate of reloads in the application. |
|
|
|
|
Log Scale |
This option should be used when the range of your data is very broad. When checked, the values are displayed using a logarithmic scale rather than using the actual values so that data on the extreme ends of the scale can be viewed more effectively. For example, if you have data that ranges from the tens to the thousands, the data in the range of the tens will be neglected visually if you do not check this option.
|
|
|
|
Time Settings |
Select a time range from the drop down menu varying from 5 Minutes to Last 7 Days. By default, the time range end point is the current time.
To change the time range, deselect the now toggle, which displays some additional date fields. You can click the left and right arrow buttons to decrease the end time by one time period (the time selected in the Time range drop down) per click, or you can choose the date and time from the associated calendar and clock icons. You can also enter the date and time in the text field using the following format: MMM dd, YYYY HH:MM:ss. For example, Aug 21, 2018 12:24 PM. Click the now toggle to reset the time range end point to the current time.
|
|
Completed Requests |
The total number of completed requests.* |
||
|
Pending Requests |
The total number of pending requests.* |
||
|
Stuck Threads |
The total number of stuck threads.* |
||
