All MySQL Instances View
Displays in this View are:
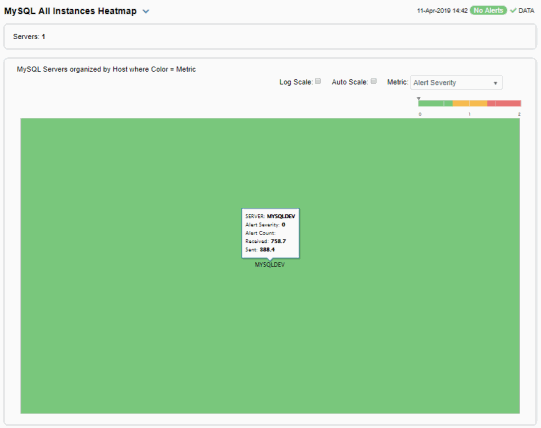
| • | RTView© Enterprise User's Guide Version 6.2: A heatmap view of all servers and their associated metrics. |
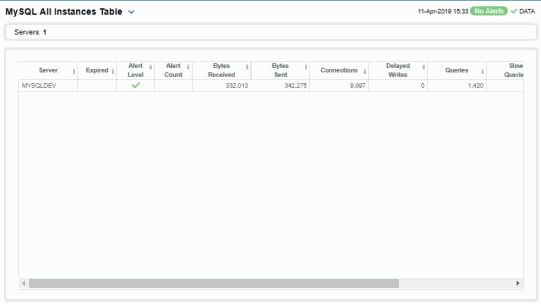
| • | RTView© Enterprise User's Guide Version 6.2: A tabular view of your servers and their associated metrics. |
Instances Heatmap
This heatmap display provides an easy-to-view interface that allows you to quickly identify the current status of each of your MySQL instances. Choose a metric from the Metric drop down menu. By default, this display shows the heatmap based on the Alert Severity metric. Other metrics are Alert Count, Received and Sent.
Each rectangle in the heatmap is a different MySQL instance. Mouse over a rectangle to see additional metrics for a server. Click a rectangle to open the RTView© Enterprise User's Guide Version 6.2 display and see additional details for the selected MySQL instance.

|
Fields and Data: |
||||
|
|
Names |
Select this check box to display the names of the instances at the top of each rectangle in the heatmap. |
||
|
|
Log |
Select to this check box to enable a logarithmic scale. Use Log Scale to see usage correlations for data with a wide range of values. For example, if a minority of your data is on a scale of tens, and a majority of your data is on a scale of thousands, the minority of your data is typically not visible in non-log scale graphs. Log Scale makes data on both scales visible by applying logarithmic values rather than actual values to the data. |
||
|
|
Auto Scale |
Select to enable auto-scaling. When auto-scaling is activated, the color gradient bar's maximum range displays the highest value. Note: Some metrics auto-scale automatically, even when Auto is not selected. |
||
|
|
Metric |
Choose a metric to view in the display. For details about the data, refer to vendor documentation. |
||
|
|
|
Alert Severity |
The current alert severity. Values range from 0 - 2, as indicated in the color gradient
|
|
|
|
|
Alert Count |
The total number of critical and warning unacknowledged alerts. The color gradient |
|
|
|
|
Received |
The total number of bytes received. The color gradient |
|
|
|
|
Sent |
The total number of bytes sent. The color gradient |
|
All MySQL Instances
Investigate detailed utilization metrics for all MySQL instances. This display provides a tabular view of the performance metrics shown in the Instances Heatmap (alert level, alert count, bytes received, and so forth), but with additional metrics such as Delayed Writes, Queries, Connections, Time Stamp and Uptime. Each row in the table contains data for a particular instance. Click a column header to sort column data in ascending or descending order. Double-click on a table row to drill-down to the Single MySQL Instance Summary display and view metrics for that particular instance. Toggle between the commonly accessed Table and Heatmap displays by clicking the drop down list on the display title.


