Mongo Collections View
These displays present several views of performance metrics for collections. Clicking Mongo Collections from the left/navigation menu opens the MongoDB Collections Table display, which allows you to view performance and utilization metrics for all collections in a particular database, or for all collections on all databases.The following displays are available:
| • | All Collections Heatmap: Opens the MongoDB Collections Heatmap display, which allows you to view performance and utilization metrics for all collections that exist in each of your connections. |
| • | Single Collection Summary: Opens the MongoDB Single Collection Summary display, which shows detailed performance and utilization metrics and trends for a specified collection on a particular database. |
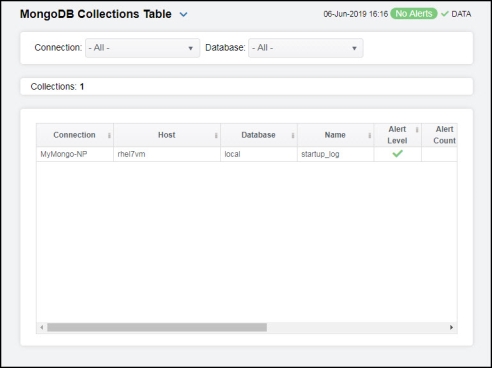
MongoDB Collections Table
Track performance and utilization metrics for all collections on a single database, or for all connections on all databases. Click a column header to sort column data in numerical or alphabetical order. Double-click on a table row to drill-down to the MongoDB Single Collection Summary display and view metrics for that particular collection. Toggle between the commonly accessed displays by clicking the drop down list on the display title.
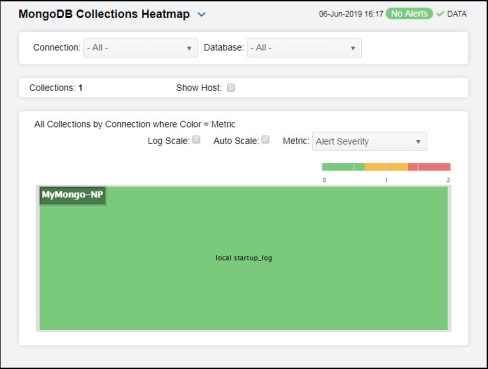
MongoDB Collections Heatmap
Clicking All Collections Heatmap in the left/navigation menu opens the MongoDB Collections Heatmap, which provides a heatmap view of the status and alerts of all collections within each connection. Use the Metric drop-down menu to view the heatmap using alert severity, alert count, number of objects, or average object size metrics.
The heatmap is organized by connection, with each rectangle representing a collection. The rectangle color indicates the most critical alert state. Click on a node to drill-down to the MongoDB Single Collection Summary display and view metrics for a particular collection.
You can select the Show Host check box to display name of the host in each rectangle. You can toggle between the commonly accessed displays by clicking the drop down list on the display title. Mouse-over rectangles to view more details about host performance and status.
|
Available Metrics |
|||
|
|
Select the metric driving the heatmap display. The default is Alert Severity. Each Metric has a color gradient bar that maps values to colors. The heatmap organizes the collections by connection, where each rectangle represents a collection. Mouse-over any rectangle to display the current values of the metrics for the collection. Click on a rectangle to drill-down to the associated MongoDB Single Collection Summary display for a detailed view of metrics for that particular collection. |
||
|
|
Alert Severity
|
The maximum alert level in the item (index) associated with the rectangle. Values range from 0 to 2, as indicated in the color gradient bar 2 -- Metrics that have exceeded their specified ALARMLEVEL threshold and have an Alert Severity value of 2 are shown in red. For a given rectangle, this indicates that one or more metrics have exceeded their alarm threshold. 1 -- Metrics that have exceeded their specified WARNINGLEVEL threshold and have an Alert Severity value of 1 are shown in yellow. For a given rectangle, this indicates that one or more metrics have exceeded their warning threshold. 0 -- Metrics that have not exceeded either specified threshold have an Alert Severity value of 0 and are shown in green. For a given rectangle, this indicates that no metrics have exceeded a specified alert threshold. |
|
|
|
Alert Count
|
The total number of alarm and warning alerts in a given item (index) associated with the rectangle. The color gradient bar |
|
|
|
Objects |
The total number of objects or documents in a given item (index) associated with the rectangle. The color gradient bar When Auto Scale is checked, the numeric values in the color gradient bar show the range of the data being displayed rather than the default values. The middle value changes accordingly to indicate the color of the middle value of the range. |
|
|
|
Avg Object Size |
The average size (in bytes) of an object in a given item (index) associated with the rectangle. The color gradient bar |
|
 , where
  shows the range of the value/color mapping. The numerical values in the gradient bar range from
  shows the range of the value/color mapping. By default, the numerical values in the gradient bar range from
  shows the range of the value/color mapping. The numerical values in the gradient bar range from
 MongoDB Single Collection Summary
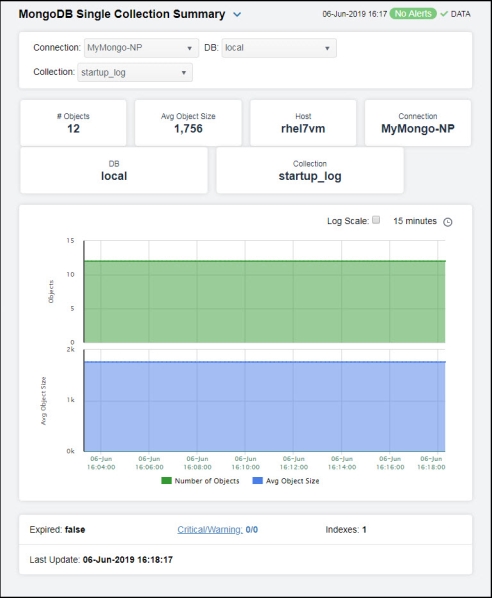
Clicking Single Collection Summary in the left/navigation menu opens the MongoDB Collection Summary display, which allows you to track performance and utilization metrics for a single collection on a single database. Clicking on the information boxes at the top of the display takes you to the MongoDB Collections Table display, where you can view additional database data.
The trend graph allows you to view trend data for the number of objects and average object size over a selected time range.
Clicking the Critical/Warning link at the bottom of the display opens the Alerts Table by Component display.