Node/Master View
These displays provide detailed data for all node instances or for a particular node instance. Clicking Node/Master from the left/navigation menu opens the Node/Master Info Table display, which shows a tabular view of your connected and recently expired node instances and their associated metrics. The following display is available:
| • | Single Node Server: Opens the Node Master Summary display, which provides a way to view trending data for individual node processes. |
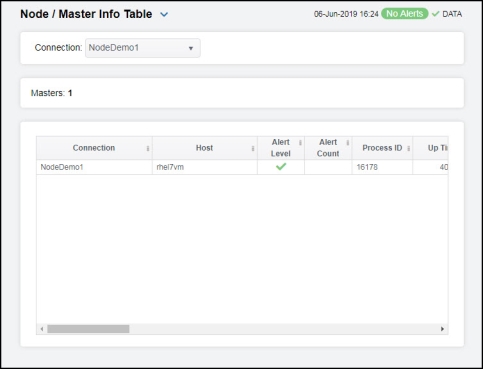
Node/Master Info Table
This table provides a view of all your connected (and recently expired) node instances and their associated metric data including host, connection, alert severity, alert count, and the current value of each gathered metric. You can click a column header to sort column data in numerical or alphabetical order, and drill-down and investigate by double-clicking a row to view details for the selected node in the Node Master Summary display. Toggle between the commonly accessed displays by clicking the drop down list on the display title.
|
Fields and Data: |
||||
|
|
Connection |
Select the name of the connection containing the node instances for which you want to view data. |
||
|
|
Masters |
The total number of node instances being monitored based on your search criteria. |
||
|
Table: |
||||
|
|
Connection |
The name of the connection. |
||
|
|
Host |
The name of the host. |
||
|
|
Alert Level |
The current alert severity.
|
||
|
|
Alert Count |
The total number of current alerts. |
||
|
|
Process ID |
The process id for the node instance. |
||
|
|
Up Time |
The amount of time the process has been running. |
||
|
|
CPU % |
The percentage of CPU used for the process. |
||
|
|
Request Count |
The total number of requests on the host. |
||
|
|
Requests/s |
The average number of requests per second on the host. |
||
|
|
Requests Delta |
The total number of requests since the last data update. |
||
|
|
Request Mean Rate |
The average number of requests for the server since monitoring was started. |
||
|
|
Requests 1 Min Rate |
The average number of requests for the last minute. |
||
|
|
Request 5 Min Rate |
The average number of requests for the last 5 minutes. |
||
|
|
Request 15 min Rate |
The average number of requests for the last 15 minutes. |
||
|
|
Expired Workers |
The number of expired workers on the host since the last data update. |
||
|
|
Arch |
The CPU architecture of the operating system on the server. Possible values are x64, arm, and ia32. |
||
|
|
ares |
The current version of C-ares running on the host. |
||
|
|
HTTP Parser |
The current version of the http parser running on the host. |
||
|
|
ICU |
The current version of ICU running on the host. |
||
|
|
Modules |
This number of modules found on the host. |
||
|
|
Node Version |
The version of node.js running on the host. |
||
|
|
OpenSSL |
The current version of OpenSSL running on the host. |
||
|
|
Platform |
The operating system’s platform. Possible values, among others, are: darwin, linux, sunos, or win32. |
||
|
|
OS Version |
The operating system’s release number. |
||
|
|
Type |
The name of the operating system. Possible values, among others, are Linux on Linux, Darwin on OS X, and Windows_NT on Windows. |
||
|
|
UV |
The current version of uv running on the host. |
||
|
|
V8 Version |
The current version of v8 running on the host. |
||
|
|
ZLib |
The current version of ZLib running on the host. |
||
|
|
Expired |
When checked, performance data has not been received within the time specified (in seconds) in the Expire Time field in the Duration region in the RTView Configuration Application > (Project Name) > Solution Package Configuration > Node.js > DATA STORAGE tab. The Delete Time field (also in the Duration region) allows you to define the amount of time (in seconds) in which the row will be removed from the table if there is no response. |
||
|
|
Time Stamp |
The date and time the row data was last updated. |
||


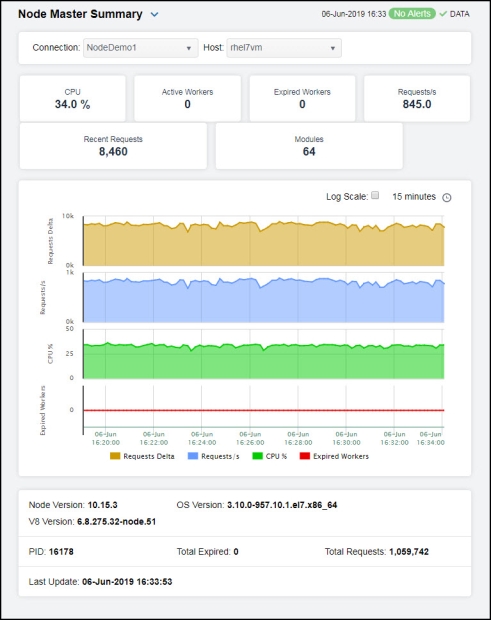
Node Master Summary
Clicking Single Node Server in the left/navigation menu opens the Node Master Summary display, which allows you to view current CPU, worker, and request data as well as trending data for the number of requests, the number of requests per second, the percentage of CPU being used, and the number of recently expired workers on a particular host. Clicking on the information boxes at the top of the display takes you to the Node/Master Info Table display, where you can view additional instance data.
Clicking the Critical/Warning link at the bottom of the display opens the Alerts Table by Component display.
|
Filter By: |
||||
|
|
Connection |
Choose the connection for which you want to show data in the display. |
||
|
|
Host |
Choose the host for which you want to show data in the display. |
||
|
Fields and Data: |
||||
|
|
CPU |
The percentage of memory used on the CPU. |
||
|
|
Active Workers |
The current number of active workers on the host. |
||
|
|
Expired Workers |
The total number of expired workers on the host. |
||
|
|
Requests/s |
The average number of requests per second on the host. |
||
|
|
Recent Requests |
The total number of requests since the last data update. |
||
|
|
Modules |
This number of modules found on the host. |
||
|
Trend Graph |
Traces the following: Request s Delta -- traces the number of requests on the host. Requests/s -- traces the number of requests per second on the host. CPU % -- traces the percentage of CPU being used on the host. Expired Workers -- traces the number of expired workers on the host. |
|||
|
|
|
Log Scale |
Select to enable a logarithmic scale. Use Log Scale to see usage correlations for data with a wide range of values. For example, if a minority of your data is on a scale of tens, and a majority of your data is on a scale of thousands, the minority of your data is typically not visible in non-log scale graphs. Log Scale makes data on both scales visible by applying logarithmic values rather than actual values to the data. |
|
|
|
|
Time Settings |
Select a time range from the drop down menu varying from 5 Minutes to Last 7 Days. By default, the time range end point is the current time.
To change the time range, deselect the now toggle, which displays some additional date fields. You can click the left and right arrow buttons to decrease the end time by one time period (the time selected in the Time range drop down) per click, or you can choose the date and time from the associated calendar and clock icons. You can also enter the date and time in the text field using the following format: MMM dd, YYYY HH:MM:ss. For example, Aug 21, 2018 12:24 PM. Click the now toggle to reset the time range end point to the current time.
|
|
|
Node Version |
The version of node.js running on the host. |
|||
|
V8 Version |
The current version of v8 running on the host. |
|||
|
OS Version |
The operating system’s version number. |
|||
|
PID |
The process id for the node instance. |
|||
|
Total Expired |
The total number of expired workers on the host. |
|||
|
Total Requests |
The total number of requests on the host. |
|||
|
Last Update |
The date and time of the last data update. |
|||