Node Processes View
These displays allow you to view the current and historical metrics for all node processes in a heatmap or tabular format for one or all hosts, or view the current and historical metrics for a single node process. Clicking Node Processes from the left/navigation menu opens the Node Processes Table display, which shows a tabular view of data for all node processes for a particular connection/host combination. The following display is available:
| • | Node Processes Heatmap: Opens the Node Processes Heatmap display, which consists of a color-coded heatmap view of data for all node processes for a particular connection/host combination. |
| • | Node Request Summary: Opens the Node Process Summary display, which allows you to view current and trending data for a single node process for a particular connection/host combination. |
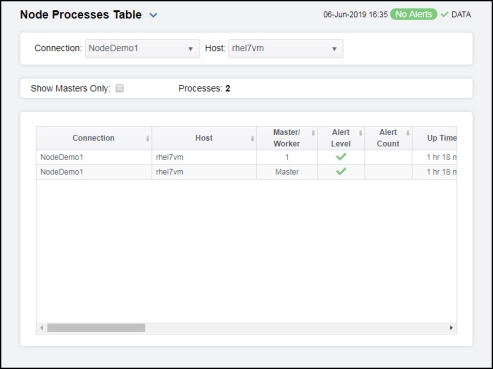
Node Processes Table
This display allows you to view memory, heap memory, and latency data for all processes in a table format. You can drill-down and view the details in the Node Process Summary display for a specific process by double-clicking on a row in the resulting table.
|
Filter By: |
||||
|
|
Connection |
Select the connection for which you want to show data in the display. |
||
|
|
Host |
Select the host for which you want to show data in the display. |
||
|
|
Show Masters Only |
Select this check box to view only masters in the table. |
||
|
Processes |
Lists the total number of processes (rows) found using the search parameters. |
|||
|
Table |
||||
|
|
Connection |
The name of the connection. |
||
|
|
Host |
The name of the host. |
||
|
|
Master / Worker |
Displays whether the process is the Master process or, if the application is clustered, the worker ID. |
||
|
|
Alert Level |
The current alert status.
|
||
|
|
Alert Count |
Total number of alerts for the process. |
||
|
|
Up Time |
Lists the amount of time the process has been up and running. |
||
|
|
CPU % |
A decimal percentage describing how much the process utilizes the CPU. |
||
|
|
Process ID |
The process ID. |
||
|
|
Memory Used |
The used memory as a fraction of total system memory, in kilobytes. |
||
|
|
Memory Used % |
The percentage of total available memory used. |
||
|
|
Mem.rss |
The Resident Set Size, which is the portion of memory held in RAM (as opposed to swap or disk), in kilobytes. |
||
|
|
Heap Total |
The total amount of heap memory from which newly created objects will originate, in kilobytes. |
||
|
|
Heap Free |
The amount of memory remaining from which newly created objects will originate, in kilobytes. |
||
|
|
Heap Used |
The heap memory currently in use, in kilobytes. |
||
|
|
Heap Used % |
The percentage of heap memory currently being used. |
||
|
|
Heap Available |
The v8 engine’s total_available_size value, in kilobytes. |
||
|
|
Heap Limit |
The v8 engine’s heap_size_limit value, in kilobytes. |
||
|
|
Heap Total Executable |
The v8 engine’s total_heap_size_executable value, in kilobytes. |
||
|
|
Latency p100 |
The number of microseconds that 100 percent of events were late in the previous 4 seconds. |
||
|
|
Latency p99 |
The number of microseconds that 99 percent of events were late in the previous 4 seconds. |
||
|
|
Latency p95 |
The number of microseconds that 95 percent of events were late in the previous 4 seconds. |
||
|
|
Latency p90 |
The number of microseconds that 90 percent of events were late in the previous 4 seconds. |
||
|
|
Latency p50 |
The number of microseconds that 50 percent of events were late in the previous 4 seconds. |
||
|
|
Lag |
The average number of milliseconds a request has to wait in the Node’s event queue before being processed. An excess lag means that the process is overloaded. |
||
|
|
Expired |
When checked, performance data has not been received within the time specified (in seconds) in the Expire Time field in the Duration region in the RTView Configuration Application > (Project Name) > Solution Package Configuration > Node.js > DATA STORAGE tab. The Delete Time field (also in the Duration region) allows you to define the amount of time (in seconds) in which the row will be removed from the table if there is no response. |
||
|
|
Time Stamp |
The date and time the row data was last updated. |
||


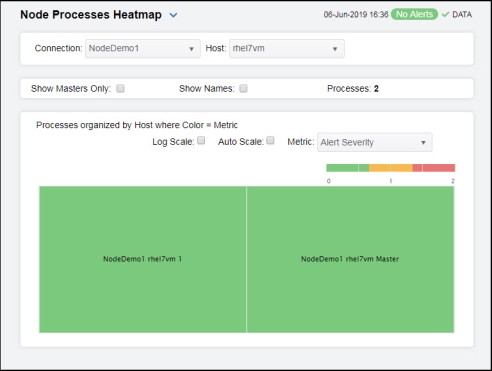
Node Processes Heatmap
Clicking Node Processes Heatmap in the left/navigation menu opens the Node Processes Heatmap display, which provides an easy-to-view interface that allows you to quickly identify the current status of each of your node processes for each available metric. You can view the node processes in the heatmap based on the following metrics: the current alert severity, the current alert count, the percentage of CPU used, and the percentage of memory used. By default, this display shows the heatmap based on the Alert Severity metric.
You can use the Show Names check-box  to include or exclude labels in the heatmap, and you can mouse over a rectangle to see additional metrics for a node process. Clicking Show Masters Only results in only the master processes appearing in the heatmap. Clicking one of the rectangles in the heatmap opens the Node Process Summary display, which allows you to see additional details for the selected node process.
|
Fields and Data: |
||||
|
|
Connection |
Select the connection for which you want to show data in the display. |
||
|
|
Host |
Select the host for which you want to show data in the display. |
||
|
|
Show Masters Only |
Select this check box to view only masters in the heatmap. |
||
|
Show Names |
Select this check box to display the names of the processes at the top of each rectangle in the heatmap. |
|||
|
Processes |
Lists the total number of processes (rows) found using the search parameters. |
|||
|
Heatmap |
||||
|
|
Log Scale |
Select to enable a logarithmic scale. Use Log Scale to see usage correlations for data with a wide range of values. For example, if a minority of your data is on a scale of tens, and a majority of your data is on a scale of thousands, the minority of your data is typically not visible in non-log scale graphs. Log Scale makes data on both scales visible by applying logarithmic values rather than actual values to the data. |
||
|
|
Auto Scale |
Select to enable auto-scaling. When auto-scaling is activated, the color gradient bar's maximum range displays the highest value. Note: Some metrics auto-scale automatically, even when Auto Scale is not selected. |
||
|
|
Metric |
Select the metric driving the heatmap display. The default is Alert Severity. Each Metric has a color gradient bar that maps values to colors. The heatmap organizes the databases by connection, where each rectangle represents a process. Mouse-over any rectangle to display the current values of the metrics for the process. Click on a rectangle to drill-down to the associated Node Process Summary display for a detailed view of metrics for that particular process. |
||
|
|
|
Alert Severity |
The current alert severity. Values range from 0 - 2, as indicated in the color gradient
|
|
|
|
|
Alert Count |
The total number of critical and warning unacknowledged alerts in the instance. The color gradient |
|
|
|
|
CPU Used % |
The percentage of CPU used. The color gradient When Auto Scale is checked, the numeric values in the color gradient bar show the range of the data being displayed rather than the default values. The middle value changes accordingly to indicate the color of the middle value of the range. |
|
|
|
|
Memory Used % |
The total percentage of memory used.The color gradient When Auto Scale is checked, the numeric values in the color gradient bar show the range of the data being displayed rather than the default values. The middle value changes accordingly to indicate the color of the middle value of the range. |
|


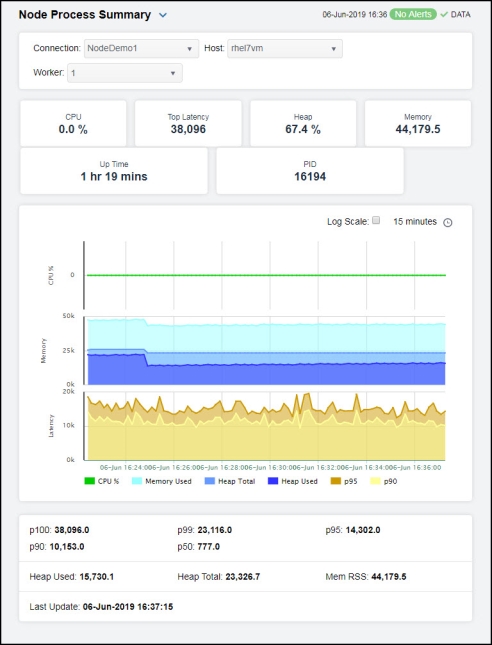
Node Process Summary
Clicking Node Process Summary in the left/navigation menu opens the Node Process Summary display, which allows you to view the current and historical metrics for a single process. You can view the current information pertaining to a particular process and various request data for the node process in the upper portion of the display. The trend graph in the bottom half of the display contains the current and historical CPU usage percentage, memory usage percentage, heap total, heap used, the number of microseconds that 95 percent of events were late in the previous 4 seconds, and the number of microseconds that 90 percent of events were late in the previous 4 seconds for the node process over a period of time.
Clicking the Critical/Warning link at the bottom of the display opens the Alerts Table by Component display.
|
Filter By: |
||||
|
|
Connection |
Select the connection for which you want to show data in the display. |
||
|
|
Host |
Select the host for which you want to show data in the display. |
||
|
|
Worker |
Select the name of the worker to view. You can select from Master or any of the worker processes created by the Master. Worker processes are defined by numbers: 1 for the first worker process created by the Master, 2 for the second worker process created by the Master, and so on. |
||
|
Fields and Data |
||||
|
CPU |
A decimal percentage describing how much the process utilizes the CPU. |
|||
|
Top Latency |
The number of microseconds that 100 percent of events were late in the previous 4 seconds. |
|||
|
Heap |
The decimal percentage of utilized heap space. |
|||
|
Memory |
The total amount of memory from which newly created objects can originate, in kilobytes. |
|||
|
Up Time |
Lists the amount of time the process has been up and running.
|
|||
|
PID |
The process ID. |
|||
|
Performance Trends Graph |
Traces the following: CPU %-- traces the CPU utilization percentage. Memory Used-- traces the amount of memory used. Heap Total-- traces the total amount of available heap memory. Heap Used-- traces the amount of used heap memory. p95 -- traces the number of microseconds that 95 percent of events were late in the previous 4 seconds. p90 -- traces number of microseconds that 90 percent of events were late in the previous 4 seconds. |
|||
|
|
|
Log Scale |
Select to enable a logarithmic scale. Use Log Scale to see usage correlations for data with a wide range of values. For example, if a minority of your data is on a scale of tens, and a majority of your data is on a scale of thousands, the minority of your data is typically not visible in non-log scale graphs. Log Scale makes data on both scales visible by applying logarithmic values rather than actual values to the data. |
|
|
|
|
Time Settings |
Select a time range from the drop down menu varying from 5 Minutes to Last 7 Days. By default, the time range end point is the current time.
To change the time range, deselect the now toggle, which displays some additional date fields. You can click the left and right arrow buttons to decrease the end time by one time period (the time selected in the Time range drop down) per click, or you can choose the date and time from the associated calendar and clock icons. You can also enter the date and time in the text field using the following format: MMM dd, YYYY HH:MM:ss. For example, Aug 21, 2018 12:24 PM. Click the now toggle to reset the time range end point to the current time.
|
|
|
p100 |
The number of microseconds that 100 percent of events were late in the previous 4 seconds. |
|||
|
p90 |
The number of microseconds that 90 percent of events were late in the previous 4 seconds. |
|||
|
p99 |
The number of microseconds that 99 percent of events were late in the previous 4 seconds. |
|||
|
p50 |
The number of microseconds that 50 percent of events were late in the previous 4 seconds. |
|||
|
p95 |
The number of microseconds that 95 percent of events were late in the previous 4 seconds. |
|||
|
Heap Used |
The heap memory currently in use, in kilobytes.
|
|||
|
Heap Total |
The total amount of memory from which newly created objects can originate, in kilobytes. |
|||
|
Mem RSS |
Resident Set Size, which is the portion of memory held in RAM (as opposed to swap or disk), in kilobytes. |
|||
|
Last Update |
The date and time of the last data update. |
|||