Node Requests View
You can view data pertaining to requests for a connection and host, or view trending request data for a particular URL associated with a connection and a host. Clicking Node Requests from the left/navigation menu opens the Node Requests Table display, which shows a tabular view of request data for one or all hosts on a particular connection. The following display is available:
| • | Node Request Summary: Opens the Node Request Summary display, which allows you to view trending data (number of requests, number of requests per second, and average response time) for individual URLs by connection and host. |
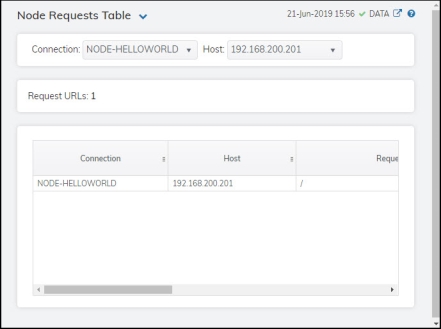
Node Requests Table
This display allows you to view request data for one or all hosts on a particular connection. You can view the request URL, total number of requests, number of requests per second, the average response time, and the number of recent requests for each host.
Drill-down and investigate by clicking a row to view details for the selected host in the Node Request Summary display. Toggle between the commonly accessed displays by clicking the drop down list on the display title.
|
Filter By: |
||||
|
|
Connection |
Select the connection for which you want to view data. |
||
|
|
Host |
Select the host for which you want to view data. |
||
|
Fields and Data: |
||||
|
|
Request URLs: |
The total number of request URLs (rows) in the table. |
||
|
Table: Column values describe the node and its associated requests. |
||||
|
|
Connection |
The name of the connection |
||
|
|
Host |
The name of the host. |
||
|
|
Request URL |
The URL from which the requests originated. |
||
|
|
Request Count |
The total number of requests. |
||
|
|
Requests / Sec |
The rate of requests since the server was started. |
||
|
|
Avg Resp Time (ms) |
The average response time (in milliseconds) since the server was started. |
||
|
|
Recent Requests |
The total number of requests based on the last query interval. |
||
|
|
Recent Requests Per Sec |
The rate of recent requests based on the last query interval. |
||
|
|
Recent Avg Response Time (ms) |
The average response time (in milliseconds) based on the last query interval. |
||
|
|
Time Stamp |
The date and time the row data was last updated. |
||
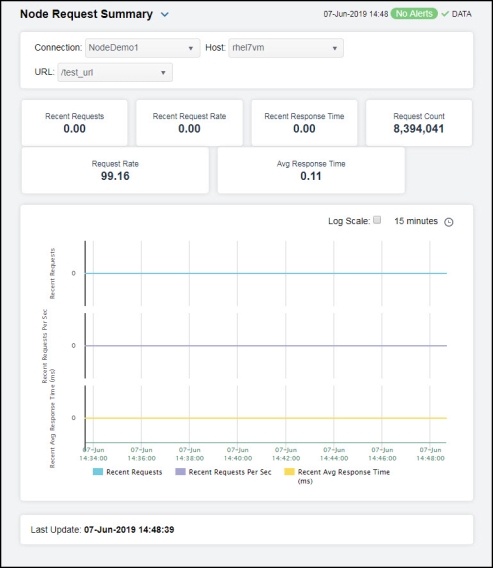
Node Request Summary
Clicking Node Request Summary in the left/navigation menu opens the Node Request Summary display, which allows you to view trending data (number of requests, number of requests per second, and average response time) for individual URLs by connection and host.
Clicking the Critical/Warning link at the bottom of the display opens the Alerts Table by Component display.
|
Filter By: |
||||
|
|
Connection |
Select the connection for which you want to show data in the display. |
||
|
|
Host |
Select the host for which you want to show data in the display. |
||
|
|
URL |
Select the URL for which you want to view data. |
||
|
Fields and Data: |
||||
|
|
Recent Requests |
The total number of requests since the last data update. |
||
|
|
Recent Request Rate |
The rate of requests since the last data update. |
||
|
|
Recent Response Time |
The average response time since the last data update. |
||
|
|
Request Count |
The total number of requests. |
||
|
|
Request Rate |
The rate of requestsl. |
||
|
|
Avg Response Time |
The average response time (in milliseconds). |
||
|
Performance Trends Graph |
Traces the following: Recent Requests -- traces the total number of requests since the last data update. Recent Requests Per Sec -- traces the rate of requests since the last data update. Recent Avg Resp Time (ms) -- traces the average response time, in milliseconds, since the last data update. |
|||
|
|
|
Log Scale |
Select to enable a logarithmic scale. Use Log Scale to see usage correlations for data with a wide range of values. For example, if a minority of your data is on a scale of tens, and a majority of your data is on a scale of thousands, the minority of your data is typically not visible in non-log scale graphs. Log Scale makes data on both scales visible by applying logarithmic values rather than actual values to the data. |
|
|
|
|
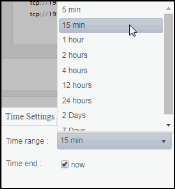
Time Settings |
Select a time range from the drop down menu varying from 5 Minutes to Last 7 Days. By default, the time range end point is the current time.
To change the time range, deselect the now toggle, which displays some additional date fields. You can click the left and right arrow buttons to decrease the end time by one time period (the time selected in the Time range drop down) per click, or you can choose the date and time from the associated calendar and clock icons. You can also enter the date and time in the text field using the following format: MMM dd, YYYY HH:MM:ss. For example, Aug 21, 2018 12:24 PM. Click the now toggle to reset the time range end point to the current time.
|
|
|
Last Update |
The date and time of the last data update. |
|||