Single WebLogic Server View
These displays present detailed performance metrics and alert statuses for a particular WebLogic server. Clicking Single WebLogic Server from the left menu opens the WebLogic Server Summary display, which allows you to track utilization, performance, and trend data for a particular WebLogic server. The following displays are available in this View:
| • | JVM Summary: Opens the WebLogic JVM Summary display, which displays the JVM details for a particular WebLogic server on a specific domain. |
| • | Server Detail: Opens the WebLogic Server Detail Tables display, which displays server runtime data, threadpool runtime data, JRockit runtime data, and server version information for a specific WebLogic server |
| • | JDBC Summary: Opens the WebLogic JDBC Summary display, which displays JDBC module utilization, performance, and trend data for a specific WebLogic server. |
| • | Work Manager: Opens the WebLogic Server Work Manager Table display, which displays server runtime data for all work managers on a specific WebLogic Server. |
| • | Persistent Stores: Opens the WebLogic JMS Persistent Stores Detail Tables display, which displays available utilization and performance data for all configurations on a specific domain. |
WebLogic Server Summary
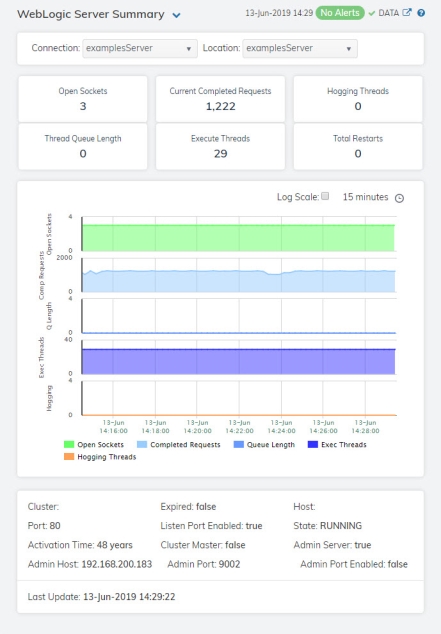
Clicking Single WebLogic Server in the left/navigation menu opens the WebLogic Server Summary display, which allows you to track utilization, performance, and trend data for a particular WebLogic server. Hovering over the information boxes at the top of the display provides additional details, and clicking on them takes you to the WebLogic Servers Table display, where you can view additional data.
In the trend graph region, you can view open socket, completed requests, queue length, execute threads, and hogging threads trend data for the selected connection/location combination.
Note: Fields with an asterisk (*) at the end of the field definition contain data that is provided by the WebLogic Server MBean interface. Refer to WebLogic documentation for more information regarding these fields.
|
Fields and Data |
|||
|
|
Connection |
Select the connection for which you want to view data. |
|
|
|
Location |
Select the name of the WLS Server located on the specified connection for which you want to view data. |
|
|
Fields and Data |
|||
|
|
Open Sockets |
The number of current open sockets for the server. |
|
|
|
Current Completed Requests |
The number of current completed requests on the server. |
|
|
|
Hogging Threads |
The current number of hogging threads.* |
|
|
|
Thread Queue Length |
The current thread queue length.* |
|
|
|
Execute Threads |
The current number of execute threads.* |
|
|
|
Total Restarts |
The total number of times the server has restarted since the last update time.* |
|
|
Trend Graph |
Displays data and a trend graph for the following: Open Sockets-- Traces the number of open sockets of the server. Completed Requests-- Traces the number of completed requests on the server. Queue Length-- Traces the queue length on the server. Exec Threads-- Traces the number of execute threads on the server. Hogging Threads-- Traces the number of hogging threads on the server. |
||
|
|
|
Log Scale |
This option should be used when the range of your data is very broad. When checked, the values are displayed using a logarithmic scale rather than using the actual values so that data on the extreme ends of the scale can be viewed more effectively. For example, if you have data that ranges from the tens to the thousands, the data in the range of the tens will be neglected visually if you do not check this option.
|
|
|
|
Time Settings |
Select a time range from the drop down menu varying from 5 Minutes to Last 7 Days. By default, the time range end point is the current time.
To change the time range, deselect the now toggle, which displays some additional date fields. You can click the left and right arrow buttons to decrease the end time by one time period (the time selected in the Time range drop down) per click, or you can choose the date and time from the associated calendar and clock icons. You can also enter the date and time in the text field using the following format: MMM dd, YYYY HH:MM:ss. For example, Aug 21, 2018 12:24 PM. Click the now toggle to reset the time range end point to the current time.
|
|
Cluster |
The name of the cluster. |
||
|
Port |
The name of the port.* |
||
|
Activation Time |
The date and time in which the server was started.* |
||
|
Admin Host |
The IP address of the administration server’s host.* |
||
|
Expired |
When true, the data has exceeded the specified cache expiration time (set by default at 45 seconds) and is no longer current. Once the cache has been refreshed and is displaying current data, this field will be set to false. This field will be set to false as long as the cache has been refreshed within the specified cache expiration time and the data is current. |
||
|
Listen Port Enabled |
When true, denotes that the listen port is enabled.* |
||
|
Cluster Master |
When true, denotes that the server is a cluster master.* |
||
|
Admin Port |
The name of the administration server’s port.* |
||
|
Host |
The name of the host.* |
||
|
State |
The current state of the WebLogic server.* |
||
|
Admin Server |
Indicates whether the server is an Administration Server.* |
||
|
Admin Port Enabled |
When true, denotes that the admin port is enabled.* |
||
|
Last Update |
The date and time of the last data update. |
||

WebLogic JVM Summary
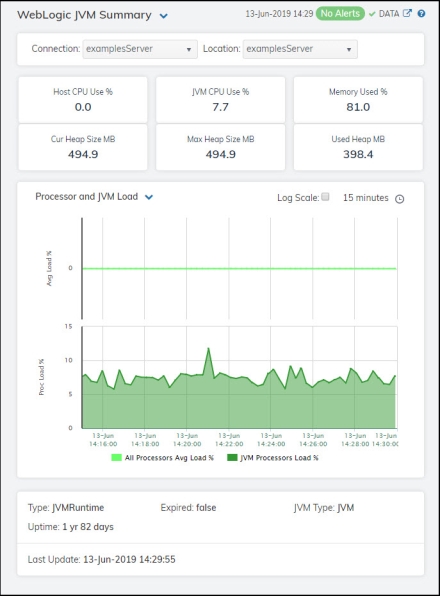
Clicking JVM Summary from the left/navigation menu opens the WebLogic JVM Summary display, which allows you to view the JVM details for a particular WebLogic server on a specific domain. Hovering over the information boxes at the top of the display provides additional details, and clicking on them takes you to the WebLogic Servers Table display, where you can view additional data.
There are two options in the trend graph region: Processor and JVM Load and Heap Memory. Selecting Processor and JVM Load traces the percentage of the host CPU being used and the percentage of the JVM CPU being used for the selected connection/location combination over a defined time range. Selecting Heap Memory traces the maximum amount of heap available, the current size of the JVM heap, and the total amount of used heap memory for the selected connection/location combination over a defined time range.
Note: Fields with an asterisk (*) at the end of the field definition contain data that is provided by the WebLogic Server MBean interface. Refer to WebLogic documentation for more information regarding these fields.
|
Filter By: |
|||
|
|
Connection |
Select the connection for which you want to view data. |
|
|
|
Location |
Select the name of the WLS Server located on the specified connection for which you want to view data. |
|
|
Fields and Data |
|||
|
|
Host CPU Use % |
The current CPU usage percentage on the host.* |
|
|
|
JVM CPU Use % |
The current JVM CPU usage percentage.* |
|
|
|
Memory Used % |
The percentage of memory used for the server. |
|
|
|
Curr Heap Size MB |
The current size of the JVM heap, in megabytes.* |
|
|
|
Max Heap Size MB |
The maximum amount of available heap memory, in megabytes.* |
|
|
|
Used Heap MB |
The amount of heap memory used, in megabytes.* |
|
|
Trend Graph |
Processor and JVM Load All Processors Avg Load % -- Traces the percentage of the host CPU being used. JVM Processors Load % -- Traces the percentage of the JVM CPU being used. Heap Memory Max Heap MB -- Traces the maximum amount of heap memory available (in megabytes). Cur Heap MB -- Traces the current size of the JVM heap, in megabytes. Used Heap MB -- Traces the total amount of heap used, in bytes.* |
||
|
|
|
Log Scale |
This option should be used when the range of your data is very broad. When checked, the values are displayed using a logarithmic scale rather than using the actual values so that data on the extreme ends of the scale can be viewed more effectively. For example, if you have data that ranges from the tens to the thousands, the data in the range of the tens will be neglected visually if you do not check this option.
|
|
|
|
Time Settings |
Select a time range from the drop down menu varying from 5 Minutes to Last 7 Days. By default, the time range end point is the current time.
To change the time range, deselect the now toggle, which displays some additional date fields. You can click the left and right arrow buttons to decrease the end time by one time period (the time selected in the Time range drop down) per click, or you can choose the date and time from the associated calendar and clock icons. You can also enter the date and time in the text field using the following format: MMM dd, YYYY HH:MM:ss. For example, Aug 21, 2018 12:24 PM. Click the now toggle to reset the time range end point to the current time.
|
|
Type |
The type of JVM currently being used on the server.* |
||
|
Uptime |
The amount of time since the server was last started, shown in days, hours, and minutes (for example, 1d 23:43).* |
||
|
Expired |
When true, the data has exceeded the specified cache expiration time (set by default at 45 seconds) and is no longer current. Once the cache has been refreshed and is displaying current data, this field will be set to false. This field will be set to false as long as the cache has been refreshed within the specified cache expiration time and the data is current. |
||
|
JVM Type |
The type of JVM currently being used on the server.* |
||
|
Last Update |
The date and time of the last data update. |
||

WebLogic Server Detail Tables
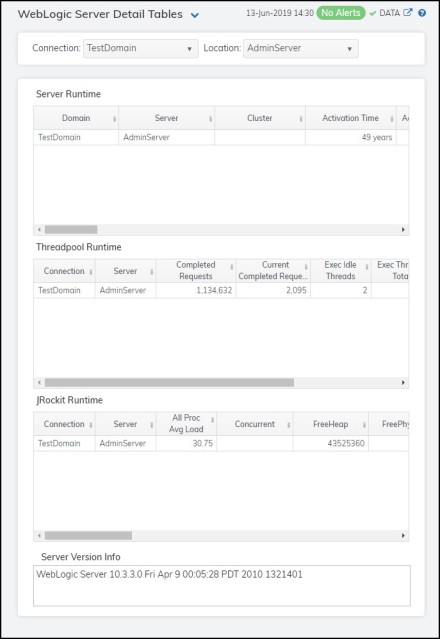
Clicking Server Detail in the left/navigation menu opens the WebLogic Server Detail Tables display, which allows you to view server runtime, threadpool runtime, JRockit runtime, and server version information for a specific WebLogic server. Double-clicking on a row in any of the tables opens the WebLogic Server Summary display, which allows you to view additional details for the server.
Note: Row columns in this table with an asterisk (*) at the end of the column definition contain data that is provided by the WebLogic Server MBean interface. Refer to WebLogic documentation for more information regarding these columns.
|
Filter By: |
|||
|
|
Connection |
Select the connection for which you want to view data. |
|
|
|
Location |
Select the name of the WLS Server located on the specified connection for which you want to see data. |
|
|
|
Server Runtime Table |
||
|
|
|
Domain |
The name of the connection. |
|
|
|
Server |
The name of the WLS Server located on the specified connection. |
|
|
|
Cluster |
The name of the cluster. |
|
|
|
Activation Time |
The time when the server was started.* |
|
|
|
Admin Server |
Indicates whether the server is an Administration Server.* |
|
|
|
Admin Host |
The address on which the Administration Server is listening for connections.* |
|
|
|
AdminServerListenPort |
The port on which the Administration Server is listening for connections.* |
|
|
|
AdminServerListenPort Secure |
Indicates whether the port that the server uses for administrative traffic is configured to use a secure protocol.* |
|
|
|
Admin Port |
The port on which this server is listening for administrative requests.* |
|
|
|
Admin Port Enabled |
Indicates whether the administration port is enabled on the server.* |
|
|
|
Cluster Master |
When checked, denotes that the cluster is a cluster master.* |
|
|
|
Current Directory |
The absolute path of the directory from which the server was started.* |
|
|
|
Host |
The machine on which the server is running.* |
|
|
|
Default URL |
The URL that clients use to connect to this server's default network channel.* |
|
|
|
Health State |
The health state of the server as reported by the server's self-health monitoring.* |
|
|
|
Listen Address |
The address on which this server is listening for connections through the default network channel.* |
|
|
|
Port |
The port on which this server is listening for connections.* |
|
|
|
Listen Port Enabled |
Indicates whether the default listen port is enabled on the server.* |
|
|
|
Name |
The name of the Java Virtual Machine.* |
|
|
|
Open Sockets |
The current number of sockets registered for socket muxing on this server.* |
|
|
|
OracleHome |
The Oracle home directory path.* |
|
|
|
Parent |
The name of the parent of the Java Virtual Machine.* |
|
|
|
PendingRestartSystem Resources |
The number of system resources that have not been restarted since the last restart of the WLS Server. |
|
|
|
Restart Required |
Indicates whether the server must be restarted in order to activate configuration changes.* |
|
|
|
Restarts |
The total number of restarts for this server since the cluster was last started.* |
|
|
|
SSL Listen Address |
The address on which this server is listening for SSL connections.* |
|
|
|
Time Stamp |
The date and time of the last data update. |
|
|
ThreadPool Runtime Table |
||
|
|
|
Connection |
The name of the connection. |
|
|
|
Server |
The name of the WLS Server located on the specified connection. |
|
|
|
Completed Requests |
The number of completed requests in the priority queue.* |
|
|
|
Current Completed Request |
The increase in the amount of completed requests (from the previous polling period to the current polling period). |
|
|
|
Exec Idle Threads |
The number of idle threads in the pool. This count does not include standby threads and stuck threads. The count indicates threads that are ready to pick up new work when it arrives.* |
|
|
|
Exec Threads Total |
The total number of threads in the pool.* |
|
|
|
Hogging Threads |
The threads that are currently being hogged by a request. These threads will either be declared as stuck after the configured timeout or will be returned to the pool. The self-tuning mechanism will backfill if necessary.* |
|
|
|
Current Hogging Threads |
The increase in the amount of hogging threads (from the previous polling period to the current polling period). |
|
|
JRockit Runtime Table |
||
|
|
|
Connection |
The name of the connection. |
|
|
|
Server |
|
|
|
|
All Proc Avg Load |
The average load of all processors in the host computer.* |
|
|
|
Concurrent |
Indicates whether the virtual machine's garbage collector runs in a separate Java thread concurrently with other Java threads.* |
|
|
|
Free Heap |
The amount, in bytes, of Java heap memory that is currently free in the virtual machine.* |
|
|
|
Free Physical Memory |
The amount, in bytes, of physical memory that is currently free on the host computer.* |
|
|
|
GC Handles Compaction |
Indicates whether the virtual machine's garbage collector compacts the Java heap.* |
|
|
|
GcAlgorithm |
The type of garbage collector (GC) that the virtual machine is using.* |
|
|
|
Heap Free Current |
The current amount of memory, in bytes, that is available in the JVM heap.* |
|
|
|
Heap Free % |
Percentage of the maximum memory that is free.* |
|
|
|
Heap Size |
The current size, in bytes, of the JVM heap.* |
|
|
|
Max Heap Size |
The maximum free memory configured for this JVM.* |
|
|
|
Incremental |
Indicates whether the virtual machine's garbage collector collects (increments) garbage as it scans the memory space and dumps the garbage at the end of its cycle. With a non-incremental garbage collector, garbage is dumped as soon as it is encountered.* |
|
|
|
JVM Description |
The description of the Java Virtual Machine.* |
|
|
|
Java VM Vendor |
The vendor of the Java Virtual Machine that the server is running.* |
|
|
|
Java Version |
The Java version of the Java Virtual Machine.* |
|
|
|
JVM Proc Load |
A snapshot of the load that the virtual machine is placing on all processors in the host computer. If the host contains multiple processors, the value represents a snapshot of the average load.* |
|
|
|
Jvm Type |
The Java Virtual Machine type.* |
|
|
|
time_stamp |
The date and time of the last data update. |
|
|
Server Version Info Region |
Lists the WebLogic server version number and date that it was installed. |
|
WebLogic JDBC Summary
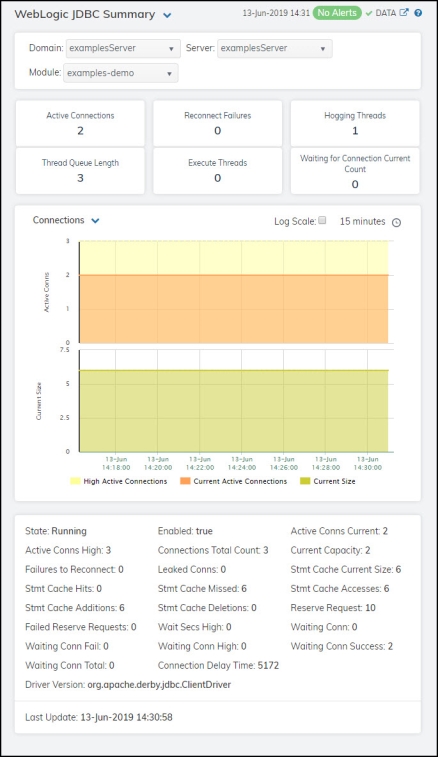
Clicking JDBC Summary in the left/navigation menu opens the WebLogic JDBC Summary display, which provides a view of JDBC module utilization, performance data, and trend data for a specific WebLogic server. Hovering over the information boxes at the top of the display provides additional details, and clicking on them takes you to the WebLogic Servers Table display, where you can view additional data.
There are two options in the trend graph region: Connections and Rates. Selecting Connections traces the highest number of active database connections in the instance of the data source since the data source was instantiated, the number of connections currently in use by applications, and the number of prepared and callable statements currently cached in the statement cache for the selected module over a defined time range. Selecting Rates traces the cumulative, running count of the number of times that the statement cache was accessed, the number of times (per second) that a statement request could not be satisfied with a statement from the cache, the cumulative (running) count of the number of statements added to the statement cache, and the cumulative (running) count of statements discarded from the cache for the selected module over a defined time range.
Note: Row columns in this table with an asterisk (*) at the end of the column definition contain data that is provided by the WebLogic Server MBean interface. Refer to WebLogic documentation for more information regarding these columns.
|
Filter By: |
|||
|
|
Domain |
Select the domain for which you want to view data. |
|
|
|
Server |
Select the server for which you want to view data. |
|
|
|
Module |
Select the module for which you want to see data. |
|
|
Fields and Data |
|||
|
|
Active Connections |
The number of connections currently in use by applications.* |
|
|
|
Reconnect Failures |
The number of times that the data source attempted to refresh a database connection and failed.* |
|
|
|
Hogging Threads |
The total number of hogging threads on this server. |
|
|
|
Thread Queue Length |
The total length of the queue thread for this server. |
|
|
|
Execute Threads |
The total number of execute threads on this server. |
|
|
|
Waiting for Connection Current Count |
The total number of connections waiting. |
|
|
Trend Graphs |
Connections High Active Conns -- Traces the highest number of active database connections in the instance of the data source since the data source was instantiated. Current Active Conns -- Traces the number of connections currently in use by applications. Current Size -- Traces the number of prepared and callable statements currently cached in the statement cache. Rates Accesses/s -- Traces the cumulative, running count of the number of times that the statement cache was accessed. Misses/s -- Traces the number of times (per second) that a statement request could not be satisfied with a statement from the cache. Additions/s -- Traces the cumulative, running count of the number of statements added to the statement cache. Deletions/s -- Traces the cumulative, running count of statements discarded from the cache. |
||
|
|
|
Log Scale |
This option should be used when the range of your data is very broad. When checked, the values are displayed using a logarithmic scale rather than using the actual values so that data on the extreme ends of the scale can be viewed more effectively. For example, if you have data that ranges from the tens to the thousands, the data in the range of the tens will be neglected visually if you do not check this option.
|
|
|
|
Time Settings |
Select a time range from the drop down menu varying from 5 Minutes to Last 7 Days. By default, the time range end point is the current time.
To change the time range, deselect the now toggle, which displays some additional date fields. You can click the left and right arrow buttons to decrease the end time by one time period (the time selected in the Time range drop down) per click, or you can choose the date and time from the associated calendar and clock icons. You can also enter the date and time in the text field using the following format: MMM dd, YYYY HH:MM:ss. For example, Aug 21, 2018 12:24 PM. Click the now toggle to reset the time range end point to the current time.
|
|
State |
The current state of the data source. |
||
|
Active Conns High |
The highest number of active database connections in the instance of the data source since the data source was instantiated.* |
||
|
Failures to Reconnect |
The number of times that the data source attempted to refresh a database connection and failed.* |
||
|
Stmt Cache Hits |
The cumulative, running count of the number of times statements from the cache were used.* |
||
|
Stmt Cache Additions |
The cumulative, running count of the number of statements added to the statement cache.* |
||
|
Failed Reserve Requests |
The cumulative, running count of requests for a connection from this data source that could not be fulfilled.* |
||
|
Waiting Conn Fail |
The cumulative, running count of requests for a connection from this data source that had to wait before getting a connection and eventually failed to get a connection.* |
||
|
Waiting Conn Total |
The cumulative, running count of requests for a connection from this data source that had to wait before getting a connection, including those that eventually got a connection and those that did not get a connection.* |
||
|
Driver Version |
The driver class name of the JDBC driver used to create database connections.* |
||
|
Enabled |
Indicates whether the data source is enabled or disabled. When checked, the data source is enabled.* |
||
|
Connections Total Count |
The cumulative total number of database connections created in this data source since the data source was deployed.* |
||
|
Leaked Conns |
The number of leaked connections. * |
||
|
Stmt Cache Missed |
The number of times that a statement request could not be satisfied with a statement from the cache.* |
||
|
Stmt Cache Deletions |
The cumulative, running count of statements discarded from the cache.* |
||
|
Wait Secs High |
The cumulative total number of database connections created in this data source since the data source was deployed.* |
||
|
Waiting Conn High |
The highest number of application requests concurrently waiting for a connection from this instance of the data source.* |
||
|
Connection Delay Time |
The average amount of time, in milliseconds, that it takes to create a physical connection to the database.* |
||
|
Active Conns Current |
The number of connections currently in use by applications.* |
||
|
Current Capacity |
The current count of JDBC connections in the connection pool in the data source.* |
||
|
Stmt Cache Current Size |
The number of prepared and callable statements currently cached in the statement cache.* |
||
|
Stmt Cache Accesses |
The cumulative, running count of the number of times that the statement cache was accessed.* |
||
|
Reserve Request |
The cumulative, running count of requests for a connection from this data source.* |
||
|
Waiting Conn |
The number of connection requests waiting for a database connection.* |
||
|
Waiting Conn Success |
The cumulative, running count of requests for a connection from this data source that had to wait before getting a connection and eventually succeeded in getting a connection.* |
||
|
Last Update |
The date and time of the last data update. |
||
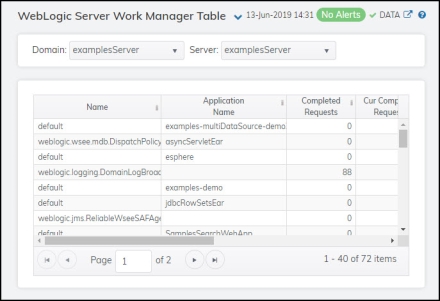
WebLogic Server Work Manager Table
Clicking Work Manager in the left/navigation menu opens the WebLogic Server Work Manager Table display, which allows you to view server runtime data for all work managers on a specific WebLogic Server. Double-clicking on a row in any of the tables opens the WebLogic Server Summary display, which allows you to view additional details for the server.
|
Filter By |
|||
|
|
Domain |
Select the domain for which you want to view data. |
|
|
|
Server |
Select the WebLogic server for which you want to see data. |
|
|
Server Runtime Table |
|||
|
|
Name |
The name of the work manager. |
|
|
|
Application Name |
The name of the application with which the work manager is associated.* |
|
|
|
Completed Requests |
The number of requests that have been completed.* |
|
|
|
Cur Completed Requests |
The increase in the amount of completed requests (from the previous polling period to the current polling period). |
|
|
|
Completed Requests/s |
The rate of completed requests (per second). |
|
|
|
Pending Requests |
The number of requests waiting in the queue.* |
|
|
|
Stuck Threads |
The number of threads that are “stuck.”* |
|
|
|
Expired |
This check box becomes automatically checked when the data displayed in the row has exceeded the specified cache expiration time (set by default at 45 seconds) and is no longer current. Once the cache has been refreshed and is displaying current data, the check box will return to being unchecked. This check box will remain unchecked as long as the cache has been refreshed within the specified cache expiration time and the data is current. |
|
|
|
time_stamp |
The date and time the data in the row was last updated. |
|
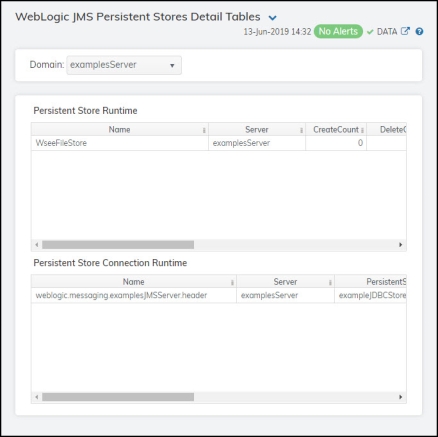
WebLogic JMS Persistent Stores Detail Tables
Clicking Persistent Stores in the left/navigation menu opens the WebLogic JMS Persistent Stores Detail Tables display, which allows you to view available utilization and performance data for all configurations on a specific domain.
|
Filter By |
|||
|
|
Domain |
Select the domain for which you want to view data. |
|
|
Persistent Store Runtime Table |
|||
|
|
|
Name |
The name of the configuration. |
|
|
|
Server |
The name of the WLS Server located on the specified connection. |
|
|
|
Create Count |
The number of create requests issued to the persistent store.* |
|
|
|
Delete Count |
The number of delete requests issued by this persistent store.* |
|
|
|
Health State |
The health state of the store.* |
|
|
|
Object Count |
The number of objects contained in the persistent store.* |
|
|
|
Physical Write Count |
The number of times the persistent store flushes its data to durable storage.* |
|
|
|
Read Count |
The number of read requests issued to this persistent store.* |
|
|
|
Update Count |
The number of update requests issued by this persistent store.* |
|
|
|
time_stamp |
The date and time the data in the row was last updated. |
|
|
Persistent Store Connection Runtime Table |
||
|
|
|
Name |
The name of the configuration. |
|
|
|
Server |
The name of the WLS Server located on the specified connection. |
|
|
|
Persistent Store Runtime |
The name of the persistent store. |
|
|
|
Create Count |
The number of create requests issued by this connection.* |
|
|
|
Delete Count |
The number of delete requests issued by this connection.* |
|
|
|
Object Count |
The number of objects contained in this connection.* |
|
|
|
Read Count |
The number of read requests issued by this connection.* |
|
|
|
Update Count |
The number of update requests issued by this connection.* |
|
|
|
time_stamp |
The date and time the data in the row was last updated. |