VMware Machines View
These displays present current and historical data for your virtual machines. Clicking VMware Machines from the left/navigation menu opens the VMware Virtual Machines Table display, which shows all available data for each virtual machine by server. The option available under VMware Machines is:
| • | Single VMware VM: Opens the VMware Virtual Machine Summary, which shows current and historical utilization and performance metrics for a single virtual machine. |
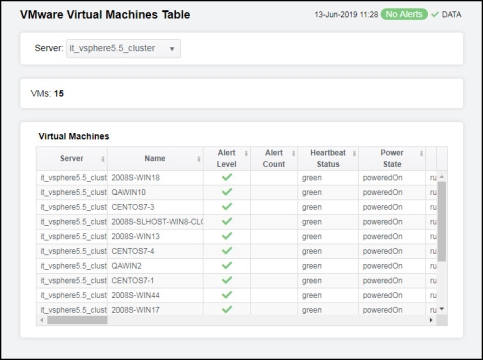
VMware Virtual Machines Table
Use this display to view all available data for each virtual machine by server.
Each row in the table lists the details for a virtual machine. Choose a server from the drop-down menus to view all virtual machines running on that server. You can click a column header to sort column data in numerical or alphabetical order.
Drill-down and investigate by double-clicking a row to view details for the selected virtual machine in the VMware Virtual Machine Summary display.
Note: Fields/columns with an asterisk (*) at the end of the field/column definition contain data that is provided by the VMWare vSphere. Refer to VMWare vsphere documentation (http://pubs.vmware.com/vsphere-65/index.jsp#com.vmware.wssdk.apiref.doc/mo-types-landing.html) for more information regarding these fields
|
Filter By: The display might include these filtering options: |
||||
|
|
Server: |
Select the server containing the virtual machines for which you want to view details. |
||
|
|
VMs: |
The total number of virtual machines (rows) in the table. |
||
|
Virtual Machines Table: Column values describe the virtual machines running on the selected sever/host combination. |
||||
|
|
Server |
The server on which the virtual machine resides. |
||
|
|
Name |
The name of the vSphere virtual machine. |
||
|
|
Alert Level |
The severity of the alert for the virtual machine.
|
||
|
|
Alert Count |
The total number of active alerts for the virtual machine. |
||
|
|
Heartbeat Status |
Displays whether or not the virtual machine has a heartbeat.*
|
||
|
|
Power State |
Displays whether or not the virtual machine is powered on.* |
||
|
|
Guest State |
The state of the guest operating system.* |
||
|
|
Number CPUs |
The number of CPUs used by the virtual machine.* |
||
|
|
VM Used CPU % |
The percentage (%) of CPUs used.* |
||
|
|
VM Memory Used (%) |
The percentage (%) of memory used by the virtual machine.* |
||
|
|
Mem Used |
The amount of used memory, in megabytes.* |
||
|
|
Memory Total MB |
The total amount of memory, in megabytes.* |
||
|
|
VM Disk Reads |
The amount of data being read from the disk per second, in kilobytes.* |
||
|
|
VM Disk Writes |
The amount of data being written to the disk per second, in kilobytes.* |
||
|
|
VM Net In KB/s |
The amount of network data received per second, in kilobytes.* |
||
|
|
VM Net OUT KB/s |
The amount of network data transmitted per second, in kilobytes.* |
||
|
|
Pkts Dropped IN % |
The percentage of incoming packets that have been lost.* |
||
|
|
Pkts Dropped OUT % |
The percentage of outgoing packets that have been lost.* |
||
|
|
Packets IN |
The total number of incoming packets.* |
||
|
|
Packets OUT |
The total number of outgoing packets.* |
||
|
|
Packet IN Dropped |
The number of incoming packets that were dropped.* |
||
|
|
Packets OUT Dropped |
The number of outgoing packets that were dropped.* |
||
|
|
Host Name |
The name of the host.* |
||
|
|
Guest Host Name |
The name of the guest host.* |
||
|
|
Guest IP Address |
The IP address of the guest.* |
||
|
|
Guest Operating System |
The operating system used by the guest.* |
||
|
|
Connection State |
The state of the current connection (connected/notConnected).* |
||
|
|
Fault Tolerance |
Displays whether or not fault tolerance is configured (configured/notConfigured).* |
||
|
|
VM Tools Running Status |
Displays whether or not the guest’s tools are running (guestToolsRunning/guestToolsNotRunning).* |
||
|
|
VM Tools Version Status |
Displays the version status of the VMware tools installed on the guest operating system.* |
||
|
|
Last Booted |
The date and time the virtual machine was last rebooted.* |
||
|
|
Expired |
When checked, performance data for that cluster has not been received in the time specified in the Duration region on the RTView Configuration > (Project Name/MISCMON-LOCAL) > Solution Package Configuration > VMWare > DATA STORAGE tab. |
||
|
|
Time Stamp |
The date and time the row data was last updated. |
||


VMware Virtual Machine Summary
Clicking Single VMware VM in the left/navigation menu opens the VMware Virtual Machine Summary display, which allows you to investigate performance issues for a particular virtual machine. Clicking on the information boxes at the top of the display takes you to the VMware Virtual Machines Table display, where you can view additional virtual machine data.
In the trend graph region, you can select from Utilization, Disk, Network, or Network Loss. Utilization traces CPU and Memory usage percentage over a specified period of time. Disk traces rate of disk reads and disk writes, CPU usage percentage, and memory usage percentage over a specified period of time. Network traces the rate of net transactions received and transmitted, as well as CPU and Memory usage percentage over a specified period of time. Network Loss traces the number of dropped incoming and outgoing packets over a specified period of time.
Clicking the Critical/Warning link at the bottom of the display opens the Alerts Table by Component display.
|
Filter By: |
||||
|
|
Server |
Select the server containing the virtual machine for which you want to view data. |
||
|
|
VM |
Select the virtual machine for which you want to view data. |
||
|
Fields and Data: |
||||
|
|
Top Disk Utilization % |
The maximum percentage of disk utilization across all disks used by the virtual machine. |
||
|
|
CPU % |
The percentage of average CPU used on the virtual machine.* |
||
|
|
Memory Utilization % |
The percentage of memory utilization on this machine. |
||
|
|
Network Rx/Tx KB/s |
The rate of network received and transmitted data, in kilobytes per second, by this virtual machine. |
||
|
|
Dropped Packets Rx/Tx |
The total number of dropped packets that were received and transmitted on this virtual machine. |
||
|
|
Disk Read/Write KB/s |
The rate of disk reads and writes, in kilobytes per second, on this virtual machine. |
||
|
Trend Graphs |
Utilization CPU % -- Traces the percentage of CPU used. Memory % -- Traces the amount of memory used. Disk Disk Reads KB/s -- Traces the amount of data being read from the disk, in kilobytes per second. Disk Writes KB/s -- Traces the amount of data being written to the disk, in kilobytes per second. CPU % -- Traces the percentage of CPU used. Memory % -- Traces the percentage of memory used. Network Network In KB/s: The amount of network data received per second, in kilobytes per second. Network Out KB/s: The amount of network data transmitted per second, in kilobytes per second. CPU % -- Traces the percentage of CPU used. Memory % -- Traces the percentage of memory used. Network Loss Dropped In Packets -- Traces the number of incoming packets that were dropped. Dropped Out Packets -- Traces the number of outgoing packets that were dropped. |
|||
|
|
|
Log Scale |
Select to enable a logarithmic scale. Use Log Scale to see usage correlations for data with a wide range of values. For example, if a minority of your data is on a scale of tens, and a majority of your data is on a scale of thousands, the minority of your data is typically not visible in non-log scale graphs. Log Scale makes data on both scales visible by applying logarithmic values rather than actual values to the data. |
|
|
|
|
Time Settings |
Select a time range from the drop down menu varying from 5 Minutes to Last 7 Days. By default, the time range end point is the current time.
To change the time range, deselect the now toggle, which displays some additional date fields. You can click the left and right arrow buttons to decrease the end time by one time period (the time selected in the Time range drop down) per click, or you can choose the date and time from the associated calendar and clock icons. You can also enter the date and time in the text field using the following format: MMM dd, YYYY HH:MM:ss. For example, Aug 21, 2018 12:24 PM. Click the now toggle to reset the time range end point to the current time.
|
|
|
Heartbeat Status |
Displays whether or not the virtual machine has a heartbeat.*
|
|||
|
Pkts Dropped IN % |
The percentage of incoming packets that were dropped.* |
|||
|
Critical/Warning |
The number of critical and warning alerts. |
|||
|
Pkts Dropped OUT % |
The percentage of outgoing packets that were dropped.* |
|||
|
Guest State |
Displays whether or not the virtual machine is running.* |
|||
|
Top Disk Free % |
The maximum percentage of free disk space across all disks used by the virtual machine. |
|||
|
Last Update |
The date and time that the data in the table was last updated. |
|||