BE Events
These displays present performance metrics and alert status for your BusinessEvents events. Clicking BE Events from the left/navigation menu opens the TIBCO BE Events Table display, which shows all available utilization metrics for all BE events. The options available under BE Events are:
| • | Event Summary: Opens the TIBCO BE Agent Event Summary display, which shows information for a single BE event. |
| • | Event Cache Hits: Opens the TIBCO BE Event Cache Hits Table display, which |
| • | Event Hit Summary: Opens the TIBCO BE Event Hit Summary display, which |
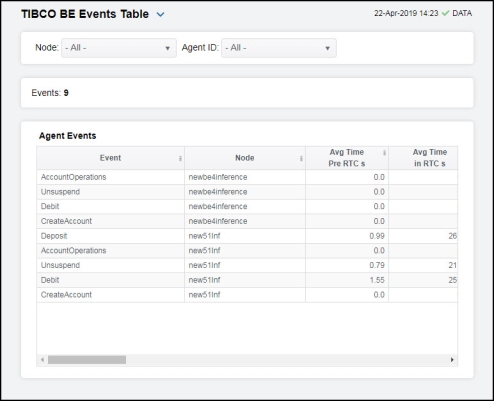
TIBCO BE Events Table
View run-time statistics for a selected group of agents. With TIBCO BusinessEvents, events are cached when they are out of scope, and deleted or persisted to the backing store when they are no longer useful. Double-clicking on a row in the table displays access patterns over time for the event in the TIBCO BE Agent Event Summary display. Each row in the table contains data for a particular event. Click a column header to sort column data in ascending or descending order. Toggle between the commonly accessed Table and Summary displays by clicking the drop down list on the display title.
NOTE: Events cause rules to execute in the BusinessEvents Rete network. Events can be created by external phenomena, such as the arrival of a JMS message, or internally when rules are processed. When an event enters the Rete network, it causes a run-to-completion cycle which continues until no further rules can be processed. Each named event that can be handled by a BusinessEvents application is specified at build time in BusinessEvents studio. For details, refer to TIBCO documentation.
|
Filter By: The display might include these filtering options: |
||||
|
|
Node: |
Select a node containing the agent for which you want to view metrics. |
||
|
|
Agent ID |
Select the agent ID for which you want to view metrics. |
||
|
Fields and Data: |
||||
|
|
Events |
The total number of events in the table. |
||
|
Agent Events Table: Each row in the table is a different event. Data in the row columns describe the event. The following fields are added by Monitor collection. The assertions/sec, modified/sec, and retracted/sec metrics are calculated from the corresponding counters as the delta between two successive samples divided by the polling interval. Note: Row columns in this table with an asterisk (*) at the end of the column definition contain data that is provided by the TIBCO MBean interface. Refer to TIBCO documentation for more information regarding these columns. |
||||
|
|
Event |
The name of the event. |
||
|
|
Node |
The name of the node. |
||
|
|
Avg Time Pre RTC s |
The average amount of time taken for the event to begin its run to completion cycle, in seconds.* |
||
|
|
Avg Time in RTC s |
The average amount of time taken for the event to complete (once it has started) its run to completion cycle, in seconds.* |
||
|
|
Avg Time Post RTC s |
The average amount of time taken by the event after its run to completion cycle has ended., in seconds.* |
||
|
|
Cache Mode |
Lists the mode used by the event, which can be either CACHE (only) or MEMORY (only).* |
||
|
|
Hits in L1 Cache |
The number of times data has been searched for in the L1 cache since the last data update.* |
||
|
|
Misses n L1 Cache |
The number of times data has been searched for in the L1 cache, but was not found, since the last data update.* |
||
|
|
Recovered |
The number of times data is not found in the L1 cache, but is found in a different cache, since the last data update.* |
||
|
|
Asserted from Agents |
The number of times the event was asserted by an agent into the Rete network.* |
||
|
|
Asserted from Channel |
The number of times the event was asserted into the Rete network via the channel.* |
||
|
|
Modified from Agents |
The number of times the event was modified by an agent in the Rete network.* |
||
|
|
Modified from Channel |
The number of times the event was modified in the Rete network via the channel.* |
||
|
|
Retracted from Agents |
The number of times the event was retracted/deleted by an agent from the Rete network.* |
||
|
|
Retracted from Channel |
The number of times the event was retracted/deleted from the Rete network via the channel.* |
||
|
|
L1 Cache Hits/s |
The rate of L1 cache hits. |
||
|
|
L1 Cache Misses/s |
The rate of L1 cache misses. |
||
|
|
Recovered /s |
The rate of recovered data. |
||
|
|
Assertions/s (Agent) |
The rate of event assertions into the Rete network by the agent. |
||
|
|
Assertions/s (Channel) |
The rate of event assertions into the Rete network via the channel. |
||
|
|
Modified/s (Agent) |
The rate of event modifications in the Rete network by the agent. |
||
|
|
Modified/s (Channel) |
The rate of event modifications in the Rete network via the channel. |
||
|
|
Retractions/sec (Agent) |
The rate of event retractions/deletions from the Rete network by the agent. |
||
|
|
Retractions/s (Channel) |
The rate of event retractions/deletions from the Rete network via the channel. |
||
|
|
agentId |
The ID of the agent. |
||
|
|
Expired |
When checked (true), performance data has not been received within the time specified (in seconds) in the Expire Time field in the Duration region in the RTView Configuration Application > (Project Name) > Solution Package Configuration > TIBCO BusinessEvents > DATA STORAGE tab. The Delete Time field (also in the Duration region) allows you to define the amount of time (in seconds) in which the row will be removed from the table if there is no response. |
||
|
|
Timestamp |
The date and time, relative to the Data Server, that data was last collected for the engine. |
||
TIBCO BE Agent Event Summary
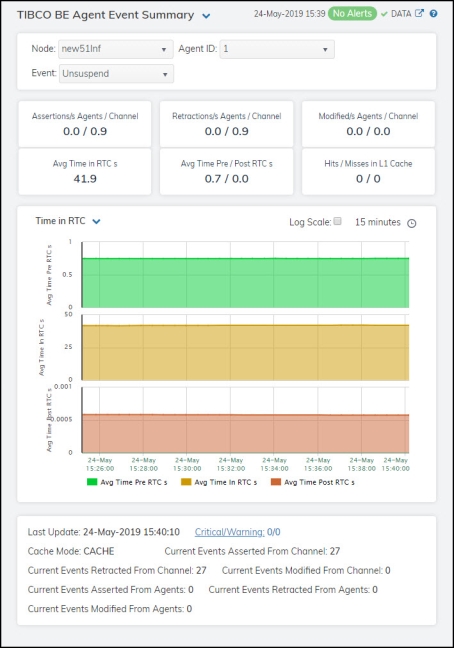
Clicking Event Summary in the left/navigation menu opens the TIBCO BE Agent Event Summary display, which allows you to view detailed performance metrics for an agent’s event.
Clicking on the information boxes at the top of the display takes you to the TIBCO BE Events Table display, where you can view additional event data. There are three options in the trend graph region: Time in RTC, Agent Rates, and Channel Rates. In the Time in RTC trend graph region, you can view the average amount of time taken for the event to begin its run to completion cycle, the average amount of time taken for the event to complete (once it has started) its run to completion cycle, and the average amount of time taken by the event after its run to completion cycle has ended over a selected time range. In the Agent Rates trend graph region, you can view rate of event assertions into the Rete network via the agent, the rate of event retractions/deletions from the Rete network via the agent, and the rate of event modifications in the Rete network via the agent over a selected time range. In the Channel Rates trend graph region, you can view rate of event assertions into the Rete network via the channel, the rate of event retractions/deletions from the Rete network via the channel, and the rate of event modifications in the Rete network via the channel over a selected time range. Clicking the Critical/Warning link at the bottom of the display opens the Alerts Table by Component display.
|
Filter By: The display might include these filtering options: Note: Fields in this display with an asterisk (*) at the end of the column definition contain data that is provided by the TIBCO MBean interface. Refer to TIBCO documentation for more information regarding these fields. |
||||
|
|
Node: |
Select the node for which you want to view metrics. |
||
|
|
Agent |
Select the agent for which you want to view metrics. |
||
|
|
Event: |
Select the event for which you want to view metrics. |
||
|
Fields and Data: Note: Fields in this display with an asterisk (*) at the end of the column definition contain data that is provided by the TIBCO MBean interface. Refer to TIBCO documentation for more information regarding these fields. |
||||
|
|
Assertions/s Agents/Channel |
The rate of assertions per second from agent, and the rate of assertions per second from channel. |
||
|
|
Retractions/s Agents/Channel |
The rate of retractions per second from agent, and the rate of retractions per second from channel. |
||
|
|
Modified Agents/Channel |
The rate of modified events per second from agent, and the rate of modified events per second from channel. |
||
|
|
Avg Time in RTC s |
The average time spent in RTC, in seconds. |
||
|
|
Avg Time Pre/Post RTC s |
The averager time in pre-RTC, and the average time in post-RTC. |
||
|
|
Hits/Misses in L1 Cache |
The number of hits in the L1 cache, and the number of misses in the L1 cache. |
||
|
Trend Graphs |
Time in RTC Shows metrics for the selected event: Avg Time Pre RTC s -- Traces the average amount of time taken for the event to begin its run to completion cycle. Avg Time in RTC s -- Traces the average amount of time taken for the event to complete (once it has started) its run to completion cycle. Avg Time Post RTC s -- Traces the average amount of time taken by the event after its run to completion cycle has ended. Agent Rates Shows metrics for the selected event: Assertions/s -- Traces the rate of event assertions, per second, via the agents. Retractions/s -- Traces the rate of event retractions, per second, via the agents. Modified/s -- Traces the rate of events modified, per second, via the agents. Channel Rates Shows metrics for the selected event: Assertions/s -- Traces the rate of events asserted, per second, via the channel. Retractions/s -- Traces the rate of events retracted, per second, via the channel. Modified/s -- Traces the rate of events modified, per second, via the channel. |
|||
|
|
|
Use Rates |
When selected, this toggle allows you to view data in the trend graph in counts per second (asserted count per second, retracted count per second, and modified count per second) instead of the default counts per selected interval (asserted count, retracted count, modified count). |
|
|
|
|
Log Scale |
This option should be used when the range of your data is very broad. When checked, the values are displayed using a logarithmic scale rather than using the actual values so that data on the extreme ends of the scale can be viewed more effectively. For example, if you have data that ranges from the tens to the thousands, the data in the range of the tens will be neglected visually if you do not check this option.
|
|
|
|
|
Time Settings |
Select a time range from the drop down menu varying from 5 Minutes to Last 7 Days. By default, the time range end point is the current time.
To change the time range, deselect the now toggle, which displays some additional date fields. You can click the left and right arrow buttons to decrease the end time by one time period (the time selected in the Time range drop down) per click, or you can choose the date and time from the associated calendar and clock icons. You can also enter the date and time in the text field using the following format: MMM dd, YYYY HH:MM:ss. For example, Aug 21, 2018 12:24 PM. Click the now toggle to reset the time range end point to the current time.
|
|
|
|
Last Update |
The date and time of the last data update. |
||
|
|
Current Events Asserted From Channel |
The number of times the event was asserted into the Rete network via the channel since the last data update.* |
||
|
|
Current Events Asserted From Agents |
The number of times the event was asserted into the Rete network via the agent since the last data update.* |
||
|
|
Critical/Warning |
The number of critical and warning alerts. |
||
|
|
Current Events Retracted From Channel |
The number of event retractions/deletions from the Rete network via the channel. |
||
|
|
Current Events Retracted From Agents |
The number of event retractions/deletions from the Rete network via the agent. |
||
|
|
Cache Mode |
Lists the mode used by the event, which can be either CACHE (only) or MEMORY (only).* |
||
|
|
Current Events Modified From Channel |
The number of event modifications in the Rete network via the channel. |
||
|
|
Current Events Modified From Agents |
The number of event modifications in the Rete network via the agents. |
||

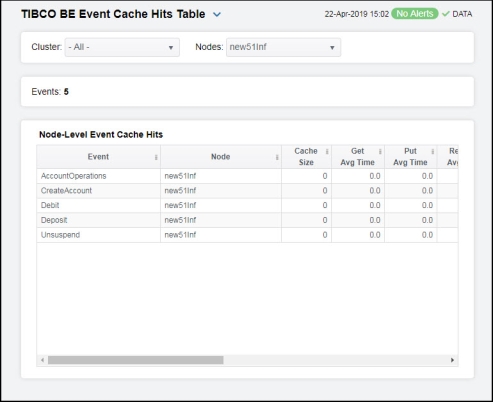
TIBCO BE Event Cache Hits Table
Clicking Event Cache Hits in the left/navigation menu opens the TIBCO BE Event Cache Hits Table display, which allows you to view cache performance metrics per event for a single cluster or All Clusters.
NOTE: Events cause rules to execute in the BusinessEvents Rete network. Events can be created by external phenomena, such as the arrival of a JMS message, or internally when rules are processed. When an event enters the Rete network, it causes a run-to-completion cycle which continues until no further rules can be processed. Each named event that can be handled by a BusinessEvents application is specified at build time in BusinessEvents studio. For details, refer to TIBCO documentation.
Click a column header to sort column data in ascending or descending order. Double-click on a table row to drill-down to the TIBCO BE Event Hit Summary display and view metrics for that particular event. Toggle between the commonly accessed Table and Summary displays by clicking the drop down list on the display title.
|
Filter By: The display might include these filtering options: |
||||
|
|
Cluster: |
Select a cluster for which you want to view metrics. |
||
|
|
Nodes: |
Select a node for which you want to view metrics. |
||
|
Events |
The total number of events in the table. |
|||
|
Node-Level Event Cache Hits Table: Each row in the table is a different event, with data in the row columns describing the event. Note: Row columns in this table with an asterisk (*) at the end of the column definition contain data that is provided by the TIBCO MBean interface. Refer to TIBCO documentation for more information regarding these columns. |
||||
|
|
Event |
The name of the event. |
||
|
|
Node |
The name of the node. |
||
|
|
Cache Size |
The size of the event’s cache.* |
||
|
|
Get Avg Time |
The average time taken for a “get” event for the node.* |
||
|
|
Put Avg Time |
The average time taken for a “put” event for the node.* |
||
|
|
Remove Avg Time |
The average time taken for a “remove” event for the node.* |
||
|
|
Gets/s |
The rate of “get” operations for the event. |
||
|
|
Puts/s |
The rate of “put” operations for the event. |
||
|
|
Removes/s |
The rate of “remove” operations for the event. |
||
|
|
Get Count |
The total number of “get” operations for the event.* |
||
|
|
Put Count |
The total number of “put” operations for the event.* |
||
|
|
Remove Count |
The total number of “remove” operations for the event.* |
||
|
|
Num Handles In Store |
The number of handles in the Backing Store for the event.* |
||
|
|
Expired |
When checked, performance data has not been received within the time specified (in seconds) in the Expire Time field in the Duration region in the RTView Configuration Application > (Project Name) > Solution Package Configuration > TIBCO BusinessEvents > DATA STORAGE tab. The Delete Time field (also in the Duration region) allows you to define the amount of time (in seconds) in which the row will be removed from the table if there is no response. |
||
|
|
Time Stamp |
The date and time, relative to the Data Server, that data was last collected for the engine. |
||
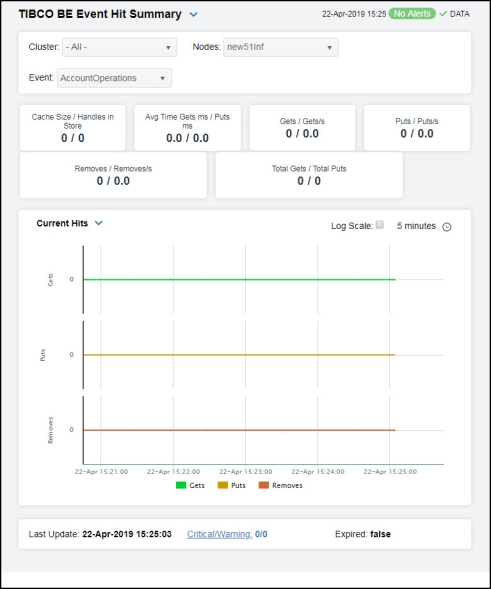
TIBCO BE Event Hit Summary
Clicking Event Hit Summary in the left/navigation menu opens the TIBCO BE Event Hit Summary display, which allows you to view detailed event performance metrics for a single cluster or All Clusters, a node, and an event.
NOTE: Events cause rules to execute in the BusinessEvents Rete network. Events can be created by external phenomena, such as the arrival of a JMS message, or internally when rules are processed. When an event enters the Rete network, it causes a run-to-completion cycle which continues until no further rules can be processed. Each named event that can be handled by a BusinessEvents application is specified at build time in BusinessEvents studio. For details, refer to TIBCO documentation.
There are two options in the trend graph region: Hit Rates and Current Hits. In the Hit Rates trend graph region, you can view the number of “get” operations per second, the number of “put” operations per second, and the number of “remove” operations per second over a selected time range. In the Current Hits trend graph region, you can view the number of “get” operations, the number of “put” operations, and the number of “remove” operations over a selected time range. Clicking the Critical/Warning link at the bottom of the display opens the Alerts Table by Component display.
|
Filter By: The display might include these filtering options: |
||||
|
|
Cluster: |
Select a cluster containing the node and event for which you want to see metrics. |
||
|
|
Nodes: |
Select a node containing the event for which you want to see metrics. |
||
|
|
Event |
Select the event for which you want to see metrics. |
||
|
Fields and Data: Note: Fields in this display with an asterisk (*) at the end of the field definition contain data that is provided by the TIBCO MBean interface. Refer to TIBCO documentation for more information regarding these fields. |
||||
|
|
Cache Size/Handles in Store |
The size of the cache, and the number of handles in the Backing Store for the event.* |
||
|
|
Avg Time Gets ms/ Puts ms |
The average time taken for a “get” operation (in milliseconds), and the average time taken for a “put” operation (in milliseconds). |
||
|
|
Gets / Gets/s |
The number of “get” operations for the event since the last data update, and the rate of “get” operations for the event. |
||
|
|
Puts / Puts/s |
The number of “put” operations for the event since the last data update, and the rate of “put” operations for the event. |
||
|
|
Removes/Removes/s |
The number of “remove” operations for the event since the last data update, and the rate of “remove” operations for the event. |
||
|
|
Total Gets/ Total Puts |
The total number of “get” operations for the event, and the total number of “remove” operations for the event. |
||
|
Trend Graphs |
Hit Rates Shows metrics for the selected cluster/node/event combination: Gets/s -- Traces the rate of “gets” per second for the event. Puts/s -- Traces the rate of “puts” per second for the event. Removes/s -- Traces the rate of “removes” per second for the event. Current Hits Shows metrics for the selected cluster/node/event combination: Gets/s -- Traces the number of “gets” for the event. Puts/s -- Traces the number of “puts” for the event. Removes/s -- Traces the number of “removes” for the event. |
|||
|
|
|
Use Rates |
When selected, this toggle allows you to view data in the trend graph in counts per second (“get” operations count per second, “put” operations count per second, and “remove” operations count per second) instead of the default counts per selected interval (“get” operations count, “put” operations count, “remove” operations count). |
|
|
|
|
Log Scale |
This option should be used when the range of your data is very broad. When checked, the values are displayed using a logarithmic scale rather than using the actual values so that data on the extreme ends of the scale can be viewed more effectively. For example, if you have data that ranges from the tens to the thousands, the data in the range of the tens will be neglected visually if you do not check this option.
|
|
|
|
|
Time Settings |
Select a time range from the drop down menu varying from 5 Minutes to Last 7 Days. By default, the time range end point is the current time.
To change the time range, deselect the now toggle, which displays some additional date fields. You can click the left and right arrow buttons to decrease the end time by one time period (the time selected in the Time range drop down) per click, or you can choose the date and time from the associated calendar and clock icons. You can also enter the date and time in the text field using the following format: MMM dd, YYYY HH:MM:ss. For example, Aug 21, 2018 12:24 PM. Click the now toggle to reset the time range end point to the current time.
|
|
|
|
Last Update |
The date and time in which the data was last updated. |
||
|
|
Critical/Warning |
The number of critical and warning alerts. |
||
|
|
Expired |
When true, performance data has not been received within the time specified (in seconds) in the Expire Time field in the Duration region in the RTView Configuration Application > (Project Name) > Solution Package Configuration > TIBCO BusinessEvents > DATA STORAGE tab. The Delete Time field (also in the Duration region) allows you to define the amount of time (in seconds) in which the row will be removed from the table if there is no response. |
||