EMS Producers
These displays present performance metrics and alert status for all producers or one producer on an EMS Server. Clicking EMS Producers from the left/navigation menu opens the TIBCO EMS Producers display, which shows all available utilization metrics for all EMS producers on a specific EMS server. The option available under EMS Producers is:
| • | Producer Summary: Opens the TIBCO EMS Producer display, which shows metrics and trend data for a particular producer on a particular EMS Server. |
TIBCO EMS Producers
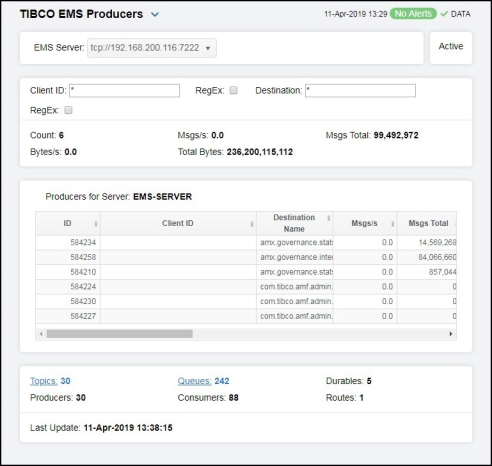
Clicking EMS Producers from the left/navigation menu opens the TIBCO EMS Producers display, which shows utilization metrics for all producers on a particular EMS Server. You can filter the list of producers in the Producers for Server table by Client ID and/or Destination. Clicking the Topics link in the bottom portion of the display opens the TIBCO EMS Topics Table display. Clicking the Queues link in the bottom portion of the display opens the TIBCO EMS Queues Table display.
|
Filters |
|||
|
|
EMS Server |
The EMS Server selected from this drop-down list displays a list of the currently connected Producers. The field to the right of the EMS Server drop down displays the status of the server. |
|
|
|
Client ID |
Filter field that allows you to filter the list of producers by client ID. |
|
|
|
RegEx |
Select this toggle to use a regular expression for the Client ID filter field. |
|
|
|
Destination |
Filter field that allows you to filter the list of producers by destination name. |
|
|
|
RegEx |
Select this toggle to use a regular expression for the Destination filter field. |
|
|
Fields and Data This display includes: |
|||
|
|
Count |
The number of currently connected producers on the server. |
|
|
|
Msgs/s |
The number of messages, per second, for the producer. |
|
|
|
Msgs Total |
The total number of messages for the producer. |
|
|
|
Bytes/s |
The amount of messages, in bytes per second, for the producer. |
|
|
|
Total Bytes |
The total size of messages, in bytes, for the producer. |
|
|
|
Producers for Server Table |
This table shows metrics for each producer on the selected server. Double-clicking on a row in the Producers table displays details for the producer in the TIBCO EMS Producer drill-down display. |
|
|
|
ID |
A unique string identifier assigned to each producer. |
|
|
|
Client ID |
A unique string identifier assigned to each client. |
|
|
|
Destination Name |
The name of the destination. |
|
|
|
|
Msgs/s |
The number of messages, per second, for the producer. |
|
|
|
Msgs Total |
The total number of messages for the producer. |
|
|
|
Bytes/s |
The size of messages, in bytes per second, for the producer. |
|
|
|
Total Bytes |
The total size of messages, in bytes, for the producer. |
|
|
|
User Name |
The user name. |
|
|
|
Host |
The name of the host. |
|
|
Session ID |
A unique string identifier assigned to each session. |
|
|
|
Conn ID |
A unique string identifier assigned to each connection. |
|
|
|
|
Create Time |
The amount of time, in milliseconds, since the producer was created. |
|
|
|
Destination Type |
The configured destination type. |
|
|
|
Expired |
When checked, performance data has not been received within the time specified (in seconds) in the Expire Time field in the Duration region in the RTView Configuration Application > (Project Name) > Solution Package Configuration > TIBCO Enterprise Message Service > DATA STORAGE tab. The Delete Time field (also in the Duration region) allows you to define the amount of time (in seconds) in which the row will be removed from the table if there is no response. |
|
|
|
time_stamp |
The date and time this row of data was last updated. |
|
|
Topics |
The total number of topics on the server (pulled directly from the TIBCO API). |
|
|
|
Producers |
The total number of producers (pulled directly from the TIBCO API). |
|
|
|
Queues |
The total number of queues on the server (pulled directly from the TIBCO API). |
|
|
|
Consumers |
The total number of consumers (pulled directly from the TIBCO API). |
|
|
|
Durables |
The total number of durables on the server (pulled directly from the TIBCO API). |
|
|
|
Routes |
The total number of routes on the server (pulled directly from the TIBCO API). |
|
|
|
Last Update |
The date and time of the last data update (pulled directly from the TIBCO API). |
|
TIBCO EMS Producer
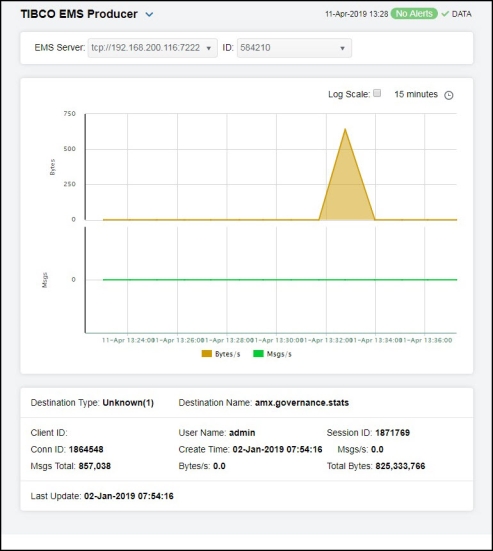
Clicking Producer Summary from the left/navigation menu opens the TIBCO EMS Producer display, which shows metrics and trend data for a particular producer on a particular EMS Server. Hovering over the trend graphs displays data for each of the metrics at a specific time.
|
Filters |
|||
|
|
EMS Server |
The selected EMS Server populates the Producer ID/ Client ID drop-down menu with associated Producer IDs/Client IDs. |
|
|
|
ID |
Drop-down menu containing the Producer IDs/Client IDs. |
|
|
Fields and Data This display includes: |
|||
|
|
Trend Graph |
Shows message data for the selected producer. Bytes/s -- Traces the size of messages for the producer, in bytes. Msgs/s -- Traces the number of messages for the producer, per second. |
|
|
|
|
Log Scale |
This option should be used when the range of your data is very broad. When checked, the values are displayed using a logarithmic scale rather than using the actual values so that data on the extreme ends of the scale can be viewed more effectively. For example, if you have data that ranges from the tens to the thousands, the data in the range of the tens will be neglected visually if you do not check this option.
|
|
|
|
Time Settings |
Select a time range from the drop down menu varying from 5 Minutes to Last 7 Days. By default, the time range end point is the current time.
To change the time range, deselect the now toggle, which displays some additional date fields. You can click the left and right arrow buttons to decrease the end time by one time period (the time selected in the Time range drop down) per click, or you can choose the date and time from the associated calendar and clock icons. You can also enter the date and time in the text field using the following format: MMM dd, YYYY HH:MM:ss. For example, Aug 21, 2018 12:24 PM. Click the now toggle to reset the time range end point to the current time.
|
|
|
Destination Type |
The configured destination type. |
|
|
|
Destination Name |
The name of the destination. |
|
|
|
Client ID |
A unique string identifier assigned to each client. |
|
|
|
Conn ID |
A unique string identifier assigned to each connection. |
|
|
|
Msgs/s |
The number of messages, per second, for the producer. |
|
|
|
Total Bytes |
The total size of messages, in bytes, for the producer. |
|
|
|
User Name |
The user name. |
|
|
|
Create Time |
The date and time when the producer was created. |
|
|
|
Msgs Total |
The total number of messages for the producer. |
|
|
|
Session ID |
A unique string identifier assigned to each session. |
|
|
|
Bytes/s |
The size of messages, in bytes per second, for the producer. |
|
|
|
Last Update |
The date and time of the last data update. |
|