Single MySQL Instance View
Displays in this View are:
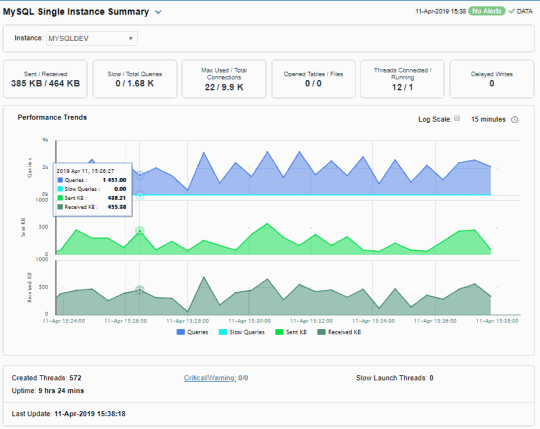
| • | Single MySQL Instance View: Displays performance, processing, alerts, memory, and trend data for a particular database server. |
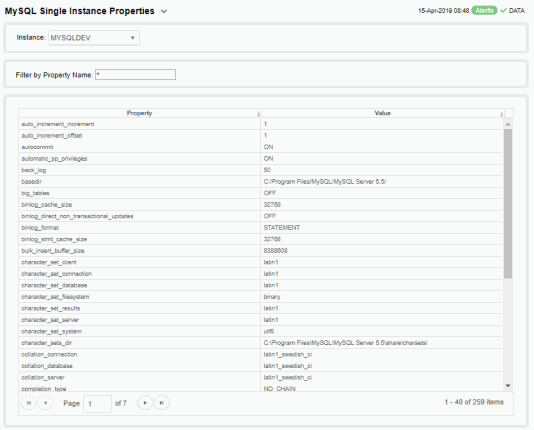
| • | Instance Properties: Displays the values of properties on servers. |
| • | RTView© Enterprise User's Guide Version 6.2: Trend graph that traces server queries, slow queries, KB sent and KB received. |
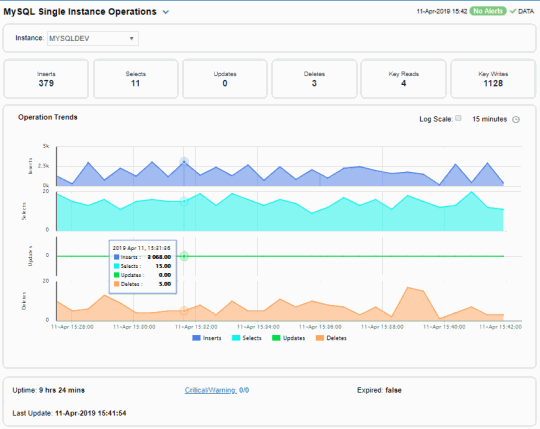
| • | Instance Operations: A tabular view of cache tables performance and utilization metrics. |
Single MySQL Instance Summary
View connection, performance and processing details for a single MySQL instance, such as the total number of kilobytes sent and received, slow and total queries, maximum memory used, number of connections, opened tables and files, as well as the number of threads connected and running and delayed writes.
Choose an instance from the Instance drop-down menu. You can also drill up to see all MySQL instances in the “All MySQL Instances” display by clicking on values in the upper area.
The bottom half of the display provides a message rates trend graph for a selected MySQL instance. You can hover over the trend graph to see the values at a particular time. You can specify the time range for the trend graph and view data based on a log scale, which enables visualization on a logarithmic scale and should be used when the range in your data is very broad.

Instance Properties
View properties and property values for a single MySQL instance.
Choose an instance from the Instance drop-down menu. Each table row is a different property for the selected instance. Enter a search string in the Property Filter field to limit the number of table rows. Click a column header to sort column data in numerical or alphabetical order.

Instance Operations
View details about operations performed for a single MySQL instance, such as the total number of inserts, selects, updates, deletes, key reads and key writes. Choose an instance from the Instance drop-down menu. Click one of the values in the upper region to drill up to the “All MySQL Instances” display.
View trending performance data for a single MySQL instance: Inserts, Selects, Updates and Deletes. Choose an instance from the Instance drop-down menu. Mouse over the trend graph to see performance metrics with time stamps.

Instance User Tables
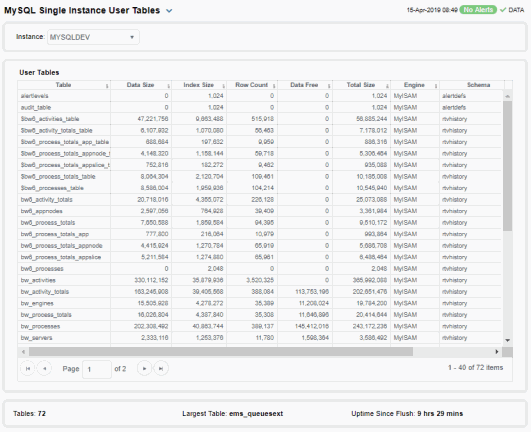
Investigate detailed utilization metrics for user tables on a single MySQL instance, such as Data Size, Index Size, Row Count and Data Free.
Each row in the table contains data for a particular user table on the selected MySQL instance. Click a column header to sort column data in ascending or descending order.
