RTView Servers Displays
The following RTView Servers displays can be found under Components tab > Processes > JVM Processes > RTView Servers after installation.
These displays present performance data for all RTView servers. Use these displays to monitor the health of the servers monitoring your system. Displays are:
| • | Data Servers : Shows metrics for RTView Data Servers. |
| • | Data Server Summary : Shows details for one Data Server. |
| • | “Display Servers”: Note that this display does not contain data. |
| • | “Display Server Summary”: Note that this display does not contain data. |
| • | Historian Servers : Shows metrics for RTView Historian Servers. |
Data Servers
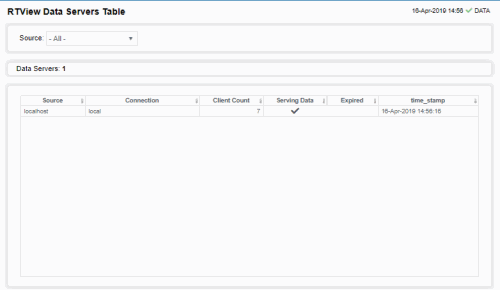
View connections on one or all RTView Data Servers, as well as connection status and client count. Choose one or All data servers from the Source: drop-down menu. Each row in the table is a different data server.
You can search, filter, sort and choose columns to include by clicking a column header icon (to the right of each column label) and selecting Filter, Sort Ascending, Sort Descending or Columns.
Or just click a column header to sort.
Right-click on a table cell to Export to Excel or Copy Cell Value.
Double-click to drill-down to details about the selected data server as well as the selected connection in the Data Server Summary display.
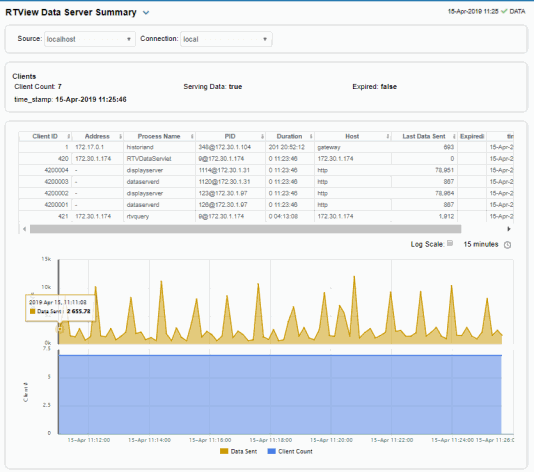
Data Server Summary
Track utilization metrics for a specific data server and a connection. Choose a data server and a connection from the Source and Connection drop-down menus. View client details such as client ID, IP address, process name, host and duration. The trend graph traces data sent and client count for the selected connection. You can hover over the trend graph to see the values at a particular time. You can specify the
time range for the trend graph and view data based on a log scale, which enables visualization
on a logarithmic scale and should be used when the range in your data is very broad.
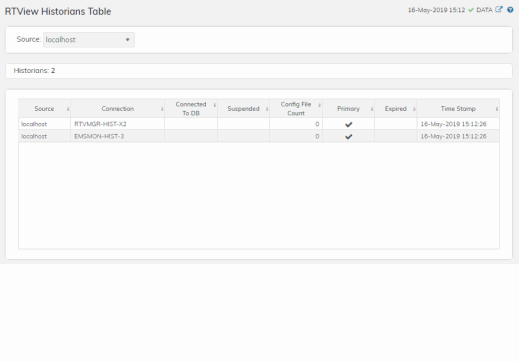
Historian Servers
Track the status of RTView Historian Servers, their connections, status and role and data configuration file usage. View the caches that are archived by the Historian application, substitution variables associated with the history cache configuration file, as well as the history cache status.
Each row in the table contains data for a particular server. You can search, filter, sort and choose columns to include by clicking a column header icon (to the right of each column label) and selecting Filter, Sort Ascending, Sort Descending or Columns. Or just click a column header to sort. Right-click on a table cell to Export to Excel or Copy Cell Value.