Common/System
RTView Enterprise includes the following displays which provide details about your RTView system setup:
| • | System Overview |
| • | RTView Data Servers |
| • | Data Server Summary |
| • | CI Type Definitions |
| • | CI Stats |
| • | Cache Table |
System Overview
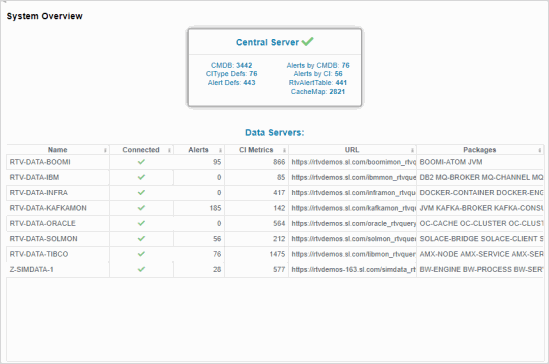
View the health status of RTViewCentral and all RTView DataServers connected to it. Use this display to find out if your data servers are all Connected. You can also get the URL for a DataServer, see which solution packages are installed and running on each (shown in the Packages field) and the number of CI Metrics that each data server is sending and compare the number of alerts among them.
The Central Server metric card shows Configuration Server-related metrics on the left:
| • | CMDB The number of CIs in the CMDB. |
| • | CIType Defs The number of CI Type definitions. |
| • | Alert Defs The number of alert settings and override definitions. |
And on the right the Central Server metric card shows Alert Server and Directory-related metrics:
| • | Alerts By CMDB The number of Services in the CMDB that currently have at least one associated alert. |
| • | Alerts By CI The number of CIs in the CMDB that currently have at least one associated alert. |
| • | RtvAlertTable The number of currently active alerts in the system. |
| • | CacheMap The number of entries currently in the directory table. |
You can hover your mouse over the Central Server metric card to get more details.
The Data Servers table contains a row of data for each connected data server. You can search, filter, sort and choose columns to include by clicking a column header icon (to the right of each column label) and selecting Filter, Sort Ascending, Sort Descending or Columns. Or just click a column header to sort.
Right-click on a table cell to Export to Excel or Copy Cell Value.
RTView Data Servers
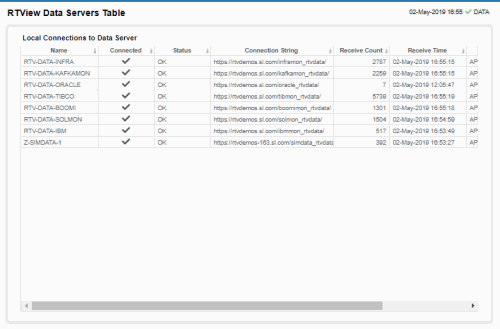
Check the connection status of all your data servers, compare their Receive Count values, get their Connection String and Config which is the RTView version installed.
Each row in the table contains data for a particular data server. You can search, filter, sort and choose columns to include by clicking a column header icon (to the right of each column label) and selecting Filter, Sort Ascending, Sort Descending or Columns. Right-click on a table cell to Export to Excel. Use Ctrl + click or Shift + click to select multiple alerts.
To investigate a data server, double-click a row to view detailed metrics for the data server in the Data Server Summary display.
Data Server Summary
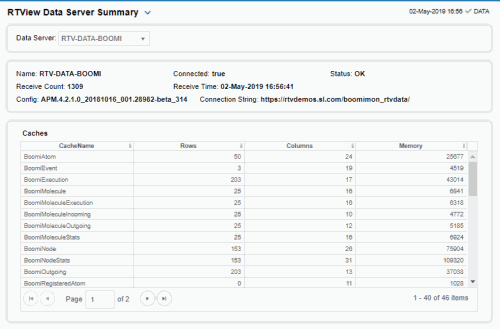
Investigate cache table sizes and memory utilization on a data server. Answer questions such as: Are the numbers of each type of data as expected for my data server?
Each row in the table contains data for a particular cache for the data server selected from the drop-down menu. You can see the number of Rows and Columns are in each cache as well as the amount of Memory used by each.
You can search, filter, sort and choose columns to include by clicking a column header icon (to the right of each column label) and selecting Filter, Sort Ascending, Sort Descending or Columns. Or just click a column header to sort.
Right-click on a table cell to Export to Excel or Copy Cell Value. Use Ctrl + click or Shift + click to select multiple alerts.
CI Type Definitions
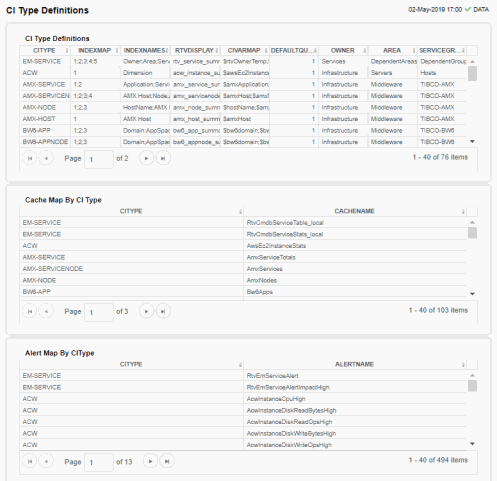
View all CI Types that are in your system, investigate their definitions and Service Model mapping, find out the name of their associated cache and their associated alert.
The CI Type Definitions table contains all CI Types that are defined in your system. Each row of data describes a particular CI Type, including:
| • | INDEXMAP: The number of indexes and the order in which they are used to form the CI Name. |
| • | INDEXNAMES: A semicolon-separated list of the index columns. |
| • | RTVDISPLAY: The name of the RTView display to drill-down to from the Alerts Table to see summary data for this CI Type. This is the target of the Go To CI button in the Alerts Table and in the Service Summary display. |
| • | CIVARMAP: The names of substitutions that must be set to drill-down to the display. |
| • | DEFAULTQUALITY: A flag indicating whether the lack of data is considered an error condition or not. |
| • | OWNER: The Owner the CIType is associated with, when the CMDB is populated automatically from CIs of this type. |
| • | AREA: The Area the CIType is associated with. |
| • | SERVICEGROUP: The SERVICEGROUP the CIType is associated with, when the CMDB is populated automatically from CIs of this type. |
The Cache Map By CI Type table lists all CI Types that are defined in your system and the name of the cache associated with each.
The Alert Map By CI Type table lists all CI Types that are defined in your system and the name of the alerts associated with each.
You can search, filter, sort and choose columns to include by clicking a column header icon (to the right of each column label) and selecting Filter, Sort Ascending, Sort Descending or Columns. Or just click a column header to sort.
Right-click on a table cell to Export to Excel or Copy Cell Value. Use Ctrl + click or Shift + click to select multiple alerts.
CI Stats
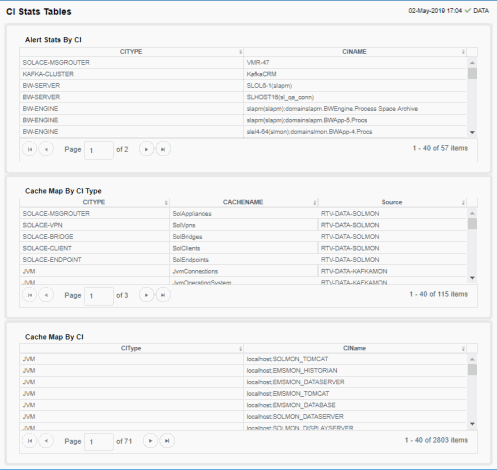
Investigate an alert and the CI associated with the alert. This display provides a list of CIs that currently have an active warning or alarm alert. You can find out where the CIs are (which cache they reside on) and the name of the CI associated with the alert.
The Alert Stats By CI table lists all CIs that currently have active warning or alarm alerts and provides the CITYPE for each.
The Cache Map By CIType table lists all CITypes for which we are receiving data, provides the associated CACHENAME and the associated Source RTView DataServer.
The Cache Map By CI table lists all CIs that we are receiving from the data servers, and provides the associated CIType.
You can search, filter, sort and choose columns to include by clicking a column header icon (to the right of each column label) and selecting Filter, Sort Ascending, Sort Descending or Columns. Or just click a column header to sort.
Right-click on a table cell to Export to Excel or Copy Cell Value. Use Ctrl + click or Shift + click to select multiple alerts.
Cache Table
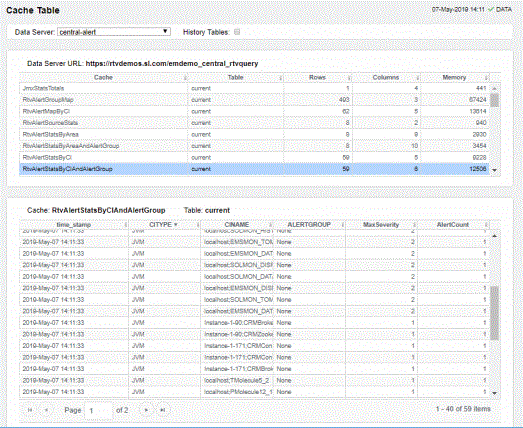
View the raw data that RTView is capturing and maintaining to investigate utilization and capacity metrics, as well as connection details, for caches on a data server.
Select a Data Server from the drop-down menu. The upper table contains a row of data for each cache on the selected data server. You can see the current number of Rows and Columns in each table and the amount of Memory used. You can also find out the cache Table type of which there are five:
| • | current tables show the most recently received values for each index. |
| • | current_condensed tables are current tables with primary compaction configured. |
| • | history tables show the historical values for each index. |
| • | history_condensed tables are history tables with primary compaction configured. |
| • | history_combo tables are history tables with primary compaction configured, and which is also configured to store rows of recent raw data followed by rows of older condensed data. |
Select a cache to see connection utilization details for that cache in the lower table. The lower table shows the contents of the selected cache table. Available columns vary by cache. For example, a JVM cache table might provide BootClassPath and InputArgument columns, and a Tomcat cache might provide RateAccess and cacheMaxSize columns.
You can search, filter, sort and choose columns to include by clicking a column header icon (to the right of each column label) and selecting Filter, Sort Ascending, Sort Descending or Columns. Or just click a column header to sort.
Right-click on a table cell to Export to Excel or Copy Cell Value. Use Ctrl + click or Shift + click to select multiple alerts. Use History Tables to include / exclude history tables in the table. Right-click on a table cell to Export to Excel or Copy Cell Value.
This low-level option can be useful to identify the source of the problem when the displays are not showing the expected data. Use this data for debugging and troubleshooting with Technical Support.
