Service Diagrams
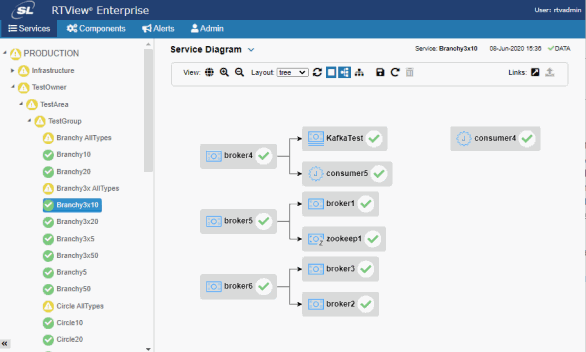
Service flow diagrams show all components within a selected service. Each node in the diagram represents a single component. The label for each node is either the Display Name (if specified) or a shortened version of the CI Name. The icon (above or to the left of the label) allows you to quickly identify the CI Type and the alert indicator (below or to the right of the label) shows the maximum alert level for the component.
To navigate to the service flow diagram, go to the Services tab and click on a single service in the service tree. The CI Stats Table opens. Click the arrow to next to the CI Stats Table title and select Service Diagram. You see one node for each row in the CI Stats Table in the selected service. Until you have defined relationships between the components, all components are laid out in a grid.

You can mouse over the node to see the CI Name, CI Type, Quality, Alert Level and Alert Count. If the CI Type supports key metrics, the mouse over also shows the names and values of all of the top level key metrics. Double-click on the node to drill down to the associated component summary display.
Defining Flow and Display Names
You can define the service flow after you configure the service model. The Infrastructure service model does not support relationships between the components. To define the flow of the components within a service, you must be logged in as rtvadmin.
To define flow and display names:
| 1. | Navigate to the flow diagram of the service you want to edit. |
| 2. | Click  then select a node and drag it to another node. This draws a directional link from the first node to the second node. To delete an existing link, right-click on the link and then click Delete in the popup menu. After you create or delete one or more links, click then select a node and drag it to another node. This draws a directional link from the first node to the second node. To delete an existing link, right-click on the link and then click Delete in the popup menu. After you create or delete one or more links, click  to save the changes to the service model. to save the changes to the service model. |
Tips
| • | with the link button  disabled, you can click and drag nodes to rearrange them in order to make it easier to draw links between them disabled, you can click and drag nodes to rearrange them in order to make it easier to draw links between them |
| • | at any point while you are editing, you can click  to re-apply the selected layout options to your diagram to re-apply the selected layout options to your diagram |
| • | Component names are limited to 15 characters or less for use in the labels. If the component name is longer than 15 characters, contains a semi-colon and the section after the last semi-colon is less than 15 characters, that is used. Otherwise, the first and last 6 characters are used separated by a ~. To specify an alternative name to use, go the CMDB Admin page on the Admin, select the component within the service, click Edit, enter a Display Name and save your changes. |
Defining Diagram Defaults
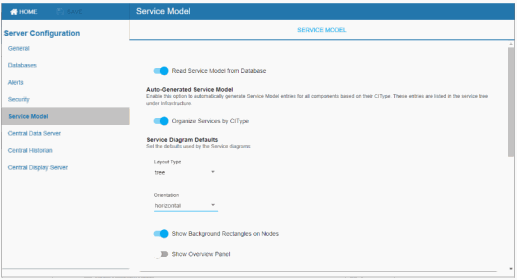
By default, diagrams use a horizontal tree layout with backgrounds rectangles on all nodes and the overview panel is off. You can change these defaults on the Service Model tab of the Configuration Application. The layout defaults are used for all diagrams and for all users unless a user has locally saved a layout for a diagram.

Viewing Service Diagrams
To navigate to the service diagram, go to the Services tab and click a single service in the service tree. This opens the CI Stats Table. Click the arrow next to the CI Stats Table title and select Service Diagram. Until relationships between the components have been defined in the Service Model, all components are laid out in a grid.
The toolbar above the diagram allows you to interact with the diagram:

View Options
 - Toggle the visibility of the overview panel.
 - Zoom In
 - Zoom Out
 - Apply the selected layout options. This is useful to restore the layout after clicking and dragging the nodes or while adding links.
 - Toggle the visibility of the icon background rectangles.
 - Use a horizontal flow (applies to tree and graph layout only).
 - Use a vertical flow (applies to tree and graph layout only).
 - Save the layout options including the positions of any manually moved nodes to the local browser storage. This will be used instead of the default layout whenever you view this diagram in the browser where it was saved.
 - Restore the layout options in the toolbar to the locally saved layout if there is one, otherwise to the default layout.
 - Delete the locally saved layout options.
Layout Options
You can select a layout type to apply to the diagram. You can also click and drag the component nodes to lay them out manually.


The tree and graph layouts are useful on diagrams where the flow (links) between nodes go mostly in one direction, from one or more root nodes to child nodes, then to grandchild nodes, and so forth. The graph layout attempts to keep the nodes arranged neatly in rows or columns, the tree layout places the nodes more closely together.
The net layout can be useful for diagrams where the flow between nodes goes in multiple directions.
The circle layout can be useful for diagrams where the flow is mostly in one direction but where there are also links from the deepest child nodes back to top level nodes.