Connectors
Displays in this View are:
| • | Configuring the RTView Endpoint within a PubSub+ Self-Contained Connector |
| • | Solace Connectors Table |
| • | Solace Connector Summary |
| • | Solace Workflows Table |
| • | Solace Workflow Trends |
Configuring the RTView Endpoint within a PubSub+ Self-Contained Connector
The PubSub+ Self-Contained Connector supports a REST interface for collection of performance metrics. This section describes how to configure the specific REST endpoint that is used by RTView.
The connector uses an open source API named Micrometer to support REST queries, for collection of metrics about the connector’s performance. The connector runs an internal instance of Tomcat with various endpoints supporting different types of REST queries. For efficiency, RTView uses an endpoint named “rtview”, which allows collection of multiple metrics in a single REST query. However, that endpoint is not enabled by default in the connector, so some configuration is required.
There are three steps
Step 3: Test your configuration changes
Step 1: Install jar files
The open-source jar files that implement the rtview endpoint are contained in a zip file deployed with RTView, in rtvapm/solmon/lib/ext/jars_for_micrometer.zip. If your connector is installed in a directory named (say) pubsubplus-connector, extract jars_for_micrometer.zip to pubsubplus-connector/libs
These 8 jar files should have been added to the libs directory:
micrometer-registry-prometheus-1.9.10.jar
opentelemetry-api-1.10.1.jar
opentelemetry-context-1.10.1.jar
simpleclient-0.15.0.jar
simpleclient_common-0.15.0.jar
simpleclient_tracer_common-0.15.0.jar
simpleclient_tracer_otel-0.15.0.jar
simpleclient_tracer_otel_agent-0.15.0.jar
Step 2: Edit application.yml
If your connector is installed in directory named (say) pubsubplus-connector, the configuration file named application.yml will typically be found in that directory. To enabled the rtview endpoint, several changes are needed in that YAML file. You should make a backup copy of the file before making any changes.
Add or edit the lines involving “prometheus” and “rtview” as shown below.
Note: A line’s indentation level is syntactically significant in YAML, and should only use spaces never tabs.
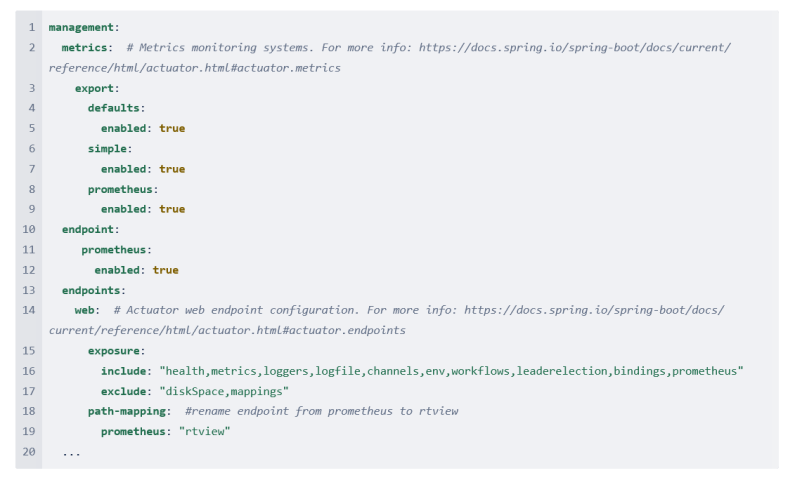
The lines that are added/changed as compared to the default application.yml file are 8-9, 10-12, 16 (prometheus added to end), and 18-19. Note that RTView also uses the endpoints named “health” and “bindings”, so be sure those are included on line 16.
Your application.yml may look different, but the important changes are to the lines as noted above.
Step 3: Test your configuration changes
Stop and restart the connector. Here is a typical command line for starting the connector (in the directory where the connector’s jar is installed):
LINUX/UNIX: nohup java -Dloader.path=libs/ -jar pubsubplus-connector-ibmmq-1.1.0.jar &
Wait a minute or so, then make the following REST query:
LINUX/UNIX: curl -v http://localhost:8090/actuator/health
If the query fails with a 401 error, specify the username/password specified in the security section of application.yml, for example:
LINUX/UNIX: curl -v -u user:pass http://localhost:8090/actuator/health
The response text should be {"status":"UP"}
Note: If the url starts with https rather than http, specify -k to accept the connector's certificate:
LINUX/UNIX: curl -k -u user:pass http://localhost:8090/actuator/health
Now try the rtview endpoint:
LINUX/UNIX: curl -v -u user:pass http://localhost:8090/actuator/rtview
The response text should be fairly large, e.g.
# HELP jvm_gc_pause_seconds Time spent in GC pause
# TYPE jvm_gc_pause_seconds summary
jvm_gc_pause_seconds_count{action="end of minor GC",cause="Metadata GC Threshold",} 1.0
jvm_gc_pause_seconds_sum{action="end of minor GC",cause="Metadata GC Threshold",} 0.027
jvm_gc_pause_seconds_count{action="end of minor GC",cause="G1 Evacuation Pause",} 120.0
jvm_gc_pause_seconds_sum{action="end of minor GC",cause="G1 Evacuation Pause",} 0.597
...
Assuming some Solace message traffic has passed through the connector (see “Solace Lab Testing Notes” section, below) the response from the 'rtview' endpoint should include a number of lines with Solace-specific metrics. For example:
curl -u user:pass -v http://localhost:8090/actuator/rtview | fgrep solace
# HELP solace_connector_message_size_payload_bytes Message payload size
# TYPE solace_connector_message_size_payload_bytes summary
solace_connector_message_size_payload_bytes_count{name="input-0",} 20.0
solace_connector_message_size_payload_bytes_sum{name="input-0",} 22000.0
# HELP solace_connector_message_size_payload_bytes_max Message payload size
# TYPE solace_connector_message_size_payload_bytes_max gauge
solace_connector_message_size_payload_bytes_max{name="input-0",} 0.0
# HELP solace_connector_message_size_total_bytes_max Total message size
# TYPE solace_connector_message_size_total_bytes_max gauge
solace_connector_message_size_total_bytes_max{name="input-0",} 0.0
# HELP solace_connector_message_size_total_bytes Total message size
# TYPE solace_connector_message_size_total_bytes summary
solace_connector_message_size_total_bytes_count{name="input-0",} 20.0
solace_connector_message_size_total_bytes_sum{name="input-0",} 22000.0
...
Connecting Data Server to the Connector using a custom property
In the Configuration Application select the Solace Data Server. On the General/CUSTOM PROPERTIES tab, add the following custom properties.
Secured:
Name: sl.rtview.cache.config
Value: sol_connector_source.rtv $solConnectorName:<ConnectorName> $solConnectorURL:'<ConnURL:ConnPort>' $solConnectorBroker:<BrokerName> $solConnectorUsername:<yourUsername> $solConnectorPassword:<yourPassword>
Filter: collector
Unsecured:
Name: sl.rtview.cache.config
Value: sol_connector_source.rtv $solConnectorName:<ConnectorName> $solConnectorURL:'<ConnURL:ConnPort>' $solConnectorBroker:<BrokerName>
Filter: collector
where:
| <ConnectorName> | A unique identifier of your Solace Connector |
| <ConnURL:ConnPort> | The http(s) URL to your Solace Connector, including the port, which is usually 8090 for the Solace Connector for IBM MQ |
| <BrokerName> | The name of the Solace Broker that is configured for integration with external technologies |
| <yourUsername> | Your username. Required if your connector has been secured. |
| <yourPassword> | Your password. Required if your connector has been secured. |
Important! If the connector has been configured to use TLS, you will need to specify the appropriate truststore file under the Security tab of the Configuration Application.
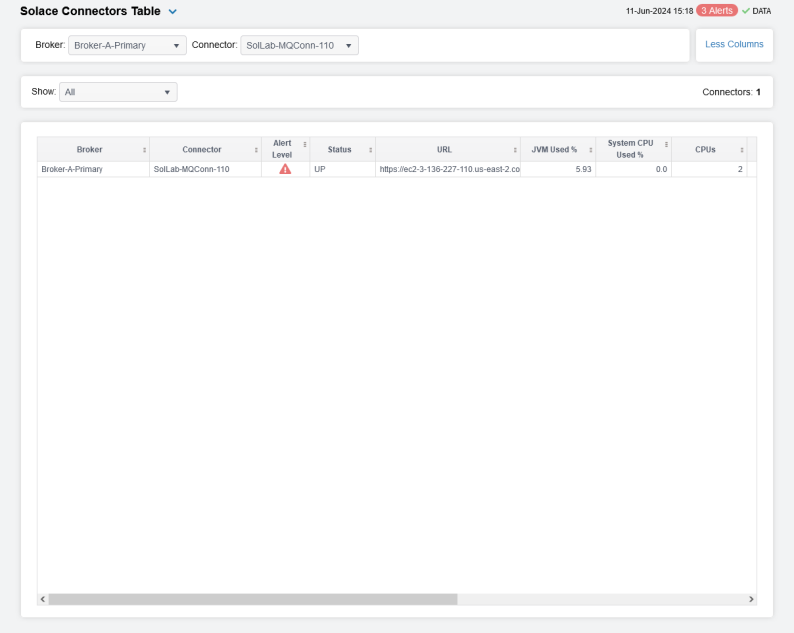
Solace Connectors Table
The Connectors Table display contains a table with one row for each connector, populated by the SolConnectors cache. Select a Brokerand Connector from the drop-down menus to filter the contents of the table.
Click a column header to sort column data in numerical or alphabetical order. Search by clicking the right side of a column heading Filter to open the Search, Sort and Choose Columns dialog:
Double-click a row to drill down for that broker to the Solace Connector Summary display.
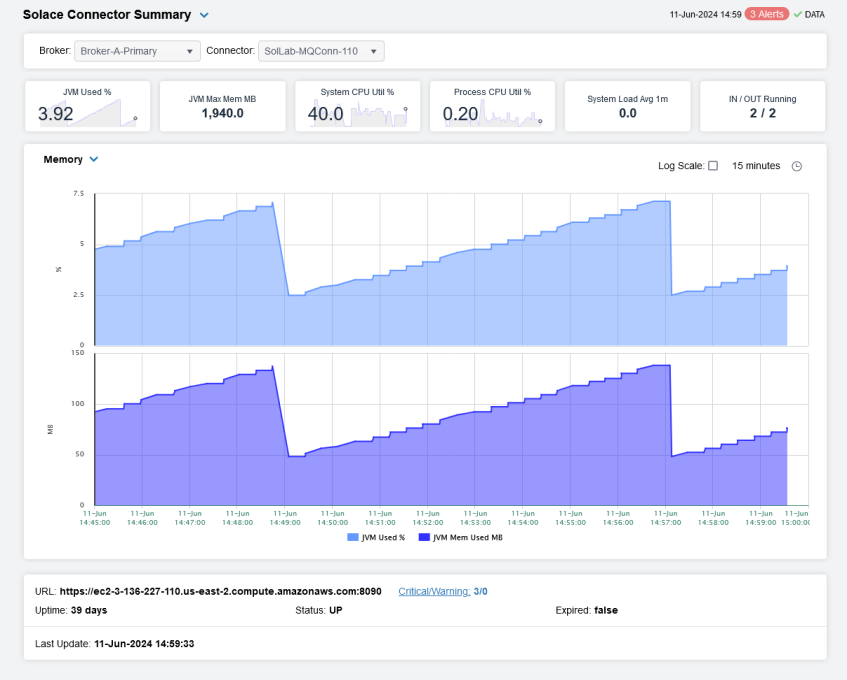
Solace Connector Summary
Select a Broker and Connector from the drop-down menus.
You can hover over the metric cards to see more performance metrics and drill down to return to the Solace Connectors Table, filtered for the selected connector.
The bottom half of the display provides current and historical performance metrics for the selected workflow. The trend graph traces the performance metric you select: Memoryor CPU Util.
You can hover over the trend graph to see the values at a particular time. You can specify the time range for the trend graph and view data based on a log scale, which enables visualization on a logarithmic scale and should be used when the range in your data is very broad.
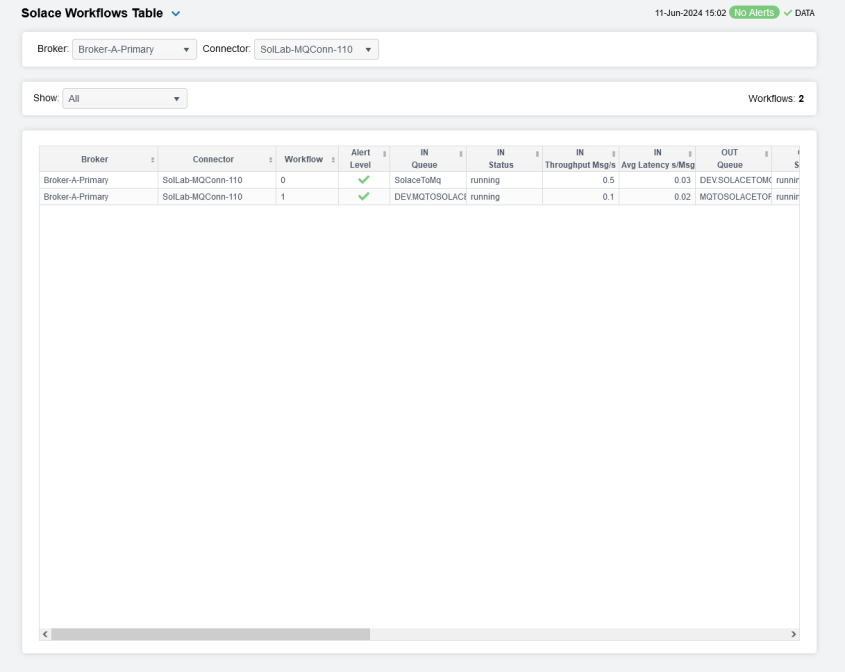
Solace Workflows Table
The Workflows Table display contains a table with one row for each workflow, populated by the SolConnectorFlows cache. Select a Brokerand Connector from the drop-down menus if you wish to filter the contents of the table.
Users can choose whether the table will show All, Expired Only, or Unexpired Only workflows.
Click a column header to sort column data in numerical or alphabetical order. Search by clicking the right side of a column heading Filter to open the Search, Sort and Choose Columns dialog.
Double-click a row to drill down for that broker to the Solace Workflow Trends display.
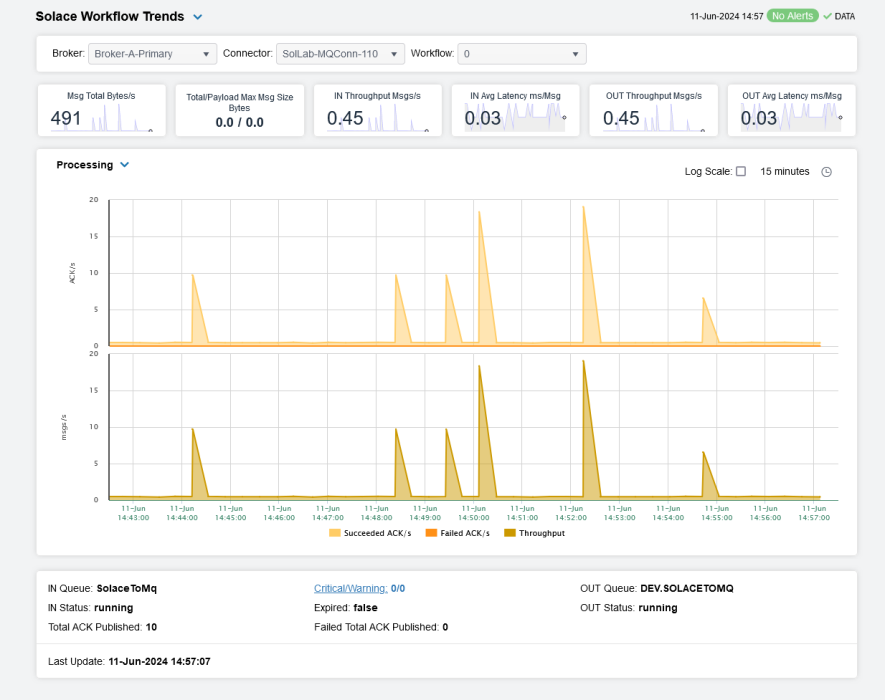
Solace Workflow Trends
Select a Broker, Connector, and Workflow from the drop-down menus.
You can hover over the metric cards to see more performance metrics and drill down to return to the Solace Workflows Table, filtered for the selected workflow..
The bottom half of the display provides current and historical performance metrics for the selected workflow. The trend graph traces the performance metric you select: Processing or Traffic.
You can hover over the trend graph to see the values at a particular time. You can specify the time range for the trend graph and view data based on a log scale, which enables visualization on a logarithmic scale and should be used when the range in your data is very broad.