IBM DB2
The IBM DB2 displays provide extensive visibility into the health and performance of IBM DB2 databases. This features an IBM DB2 Overview Display (pictured below), and the following Views which can be found under Components tab > Databases> IBM DB2 Database:
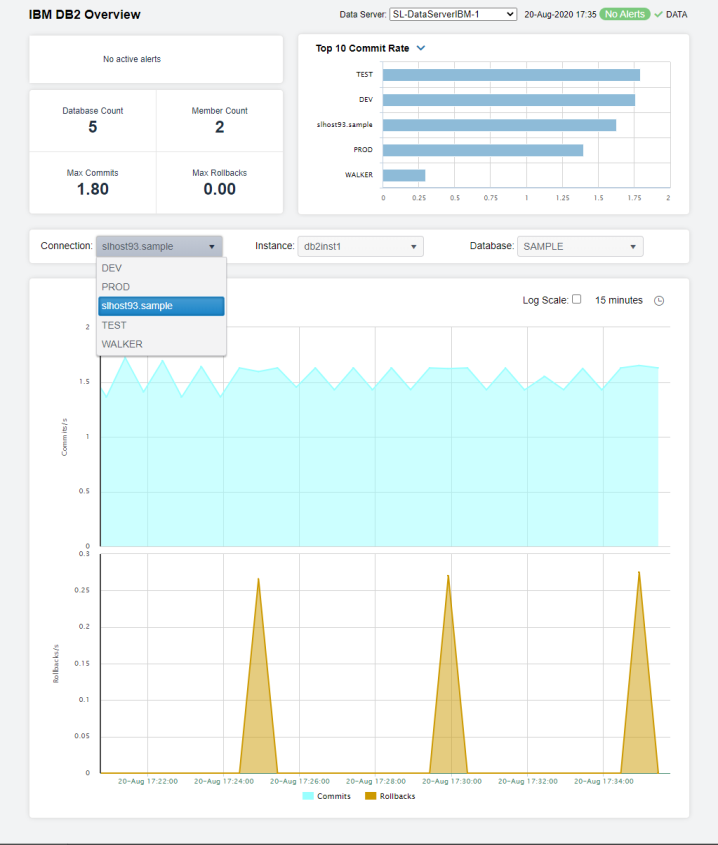
IBM DB2 Overview Display
The IBM DB2 Database Overview is the top-level display for the IBM DB2 Database Solution Package, which provides a good starting point for immediately getting the status of all your IBM DB2 databases on your Data Server.
You can select the RTView DataServer for which you want to see data and easily view the current data for that DataServer including:
|
•
|
The total number of Active Alerts, including the total number of critical and warning alerts. |
|
•
|
The Database Count and Member Count for the data server. |
|
•
|
The number of Max Commits and Max Rollbacks across all databases on the data server. |
|
•
|
A bar graph showing the Top 10 Commit Rate. |
You can hover over each region in the upper half of the Overview to see more detail. You can also drill-down to see even more detail in the DB2 Members Table, for example, by clicking on each respective region in the Overview.
The bottom half of the display allows you to select an Instance and a Database for the performance trend graph to trace Commits and Rollbacks. You can hover over the trend graph to see the values at a particular time. You can specify the time range for the trend graph and view data based on a log scale, which enables visualization on a logarithmic scale and should be used when the range in your data is very broad.
©2013-2024 Sherrill-Lubinski Corporation. All Rights Reserved.
