RTView Host Agent
The Solution Package for the RTView Host Agent monitors the health and performance of your physical servers. These predefined displays allow you to be alerted when hosts reach a critical condition. You can also see their performance impact on the technologies and applications they support. Metrics include CPU, memory and storage utilization, process resource consumption and network traffic load.
The RTView Host Agent is installed onto each host you wish to monitor.
The Solution Package for the RTView Host Agent features an overview display, Hosts Overview, and the following displays which can be found under Components tab > Hosts:
| • | Hosts Heatmap |
| • | Hosts Table |
| • | Host Summary |
| • | Host Processes |
| • | Host Network Interfaces |
| • | Host Storages |
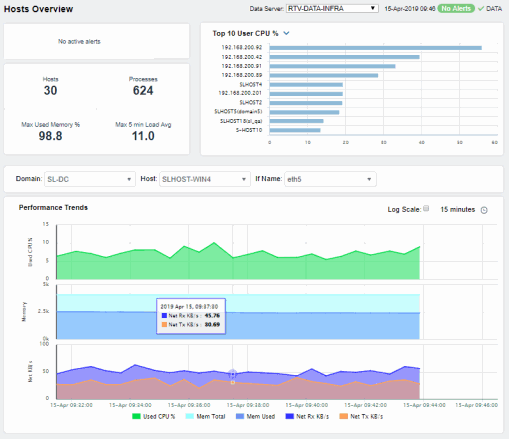
Hosts Overview
The Hosts Overview is the top-level display for the Hosts Solution Package, which provides a good starting point for immediately getting the status of all your connections on your Data Server. You can select the RTView DataServer for which you want to see data and easily view the current data for that DataServer including:
The total number of active alerts, hosts, processes as well as the maximum percent of memory used and the maximum load average.
A bar graph shows the top 10 CPU users.
You can hover over each region in the upper half of the Overview to see more detail. You can also drill down to see even more detail by clicking on each respective region in the Overview. For example, clicking on the Max Used Memory % region opens the Host Summary display.
The bottom half of the display provides a message rates trend graph for a selected Domain, Host and If Name. You can hover over the trend graph to see the values at a particular time. You can specify the time range for the trend graph and view data based on a log scale, which enables visualization in a logarithmic scale and should be used when the range in your data is very broad.
Hosts Heatmap
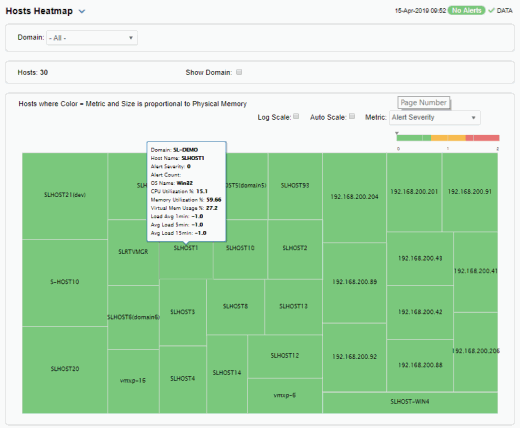
View the status and most critical alert states of all your hosts. Use this display to quickly identify hosts with critical alerts.
Each rectangle in the heatmap represents a host. The rectangle color indicates the most critical alert state associated with the host for the selected Metric. The rectangle size represents the amount of physical memory present on the host; a larger size is a larger value.
 Red indicates that one or more metrics exceeded their ALARM LEVEL threshold.
 Yellow indicates that one or more metrics exceeded their WARNING LEVEL threshold.
 Green indicates that no metrics have exceeded their alert thresholds.
Choose a domain or All Domains from the Domain drop-down menu to filter data shown in the display. By default, this display shows Alert Severity. You can choose other metrics such as Alert Count, CPU Utilization and Virtual Memory Utilization.
Toggle between the commonly accessed Table and Heatmap displays by clicking the drop down list on the display title.
Mouse-over rectangles to view more details about host performance and status.Drill-down and investigate a host by clicking a rectangle in the heatmap to view details in the Host Summary display.
|
|
Metric |
Choose a metric to view in the display. |
||
|
|
|
Alert Severity |
The maximum level of alerts in the heatmap rectangle. Values range from 0 - 2, as indicated in the color gradient
|
|
|
|
|
Alert Count |
The total number of critical and warning alerts in the heatmap rectangle. The color gradient |
|
|
|
|
% CPU Utilization |
The percent of CPU used in the heatmap rectangle. The color gradient |
|
|
|
|
% Memory Used |
The percent of memory used in the heatmap rectangle. The color gradient |
|
|
|
|
% Virtual Memory Used |
The percent of virtual memory used in the heatmap rectangle. The color gradient |
|
|
|
|
Load Avg 1 Min |
The average number of processes running over 1 minute. |
|
Hosts Table
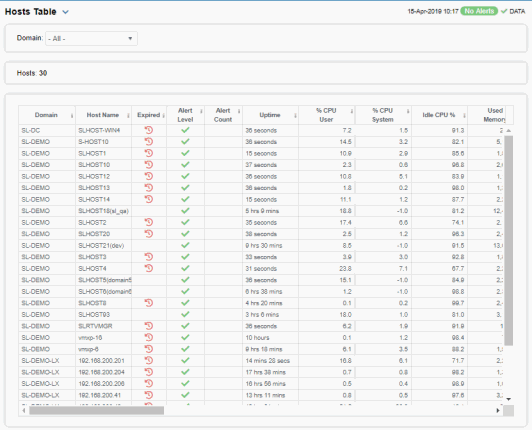
Investigate detailed utilization metrics and configuration details for all hosts in one or all domains. This display contains all metrics available for hosts, including the number of current client connections.
Choose a domain or All Domains from the Domain drop-down menu. Each row in the table is a different host. Click a column header to sort ascending or descending order. Drill-down and investigate by clicking a row to view details for the selected application in the Host Summary display. Toggle between the commonly accessed Table and Heatmap displays by clicking the drop down list on the display title.
Host Summary
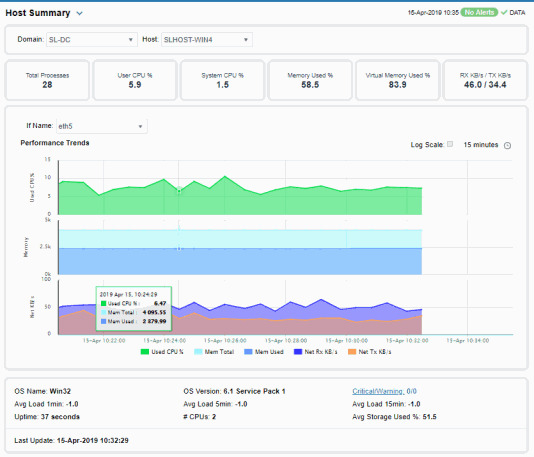
Track utilization and performance metrics for a single host in any domain. Choose a domain from the Domain and a Host from the drop-down menus. Clicking on the process and utilization boxes at the top of the display takes you to the Hosts Table display, where you can view all data available for the host.
In the trend graph region, you can select an If Name associated with the selected host and set the time range to trace Total Processes, User CPU%, System CPU%, Mem Used%, Virtual Memory Used% or Rx KB/s/TX KB/s.
Click the Critical/Warning link at the bottom of the display to open the Alerts Table by Component display.
Host Processes
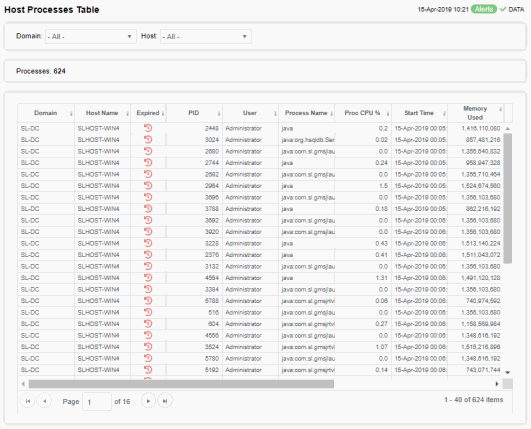
Investigate detailed process utilization metrics for one or all hosts in one or all domains. This display contains all metrics available for processes including the amount of memory used by each process.
Choose a domain or All Domains and a host or All Hosts from the drop-down menus. Each row in the table is a different process. Click a column header to sort ascending or descending order.
Host Network Interfaces
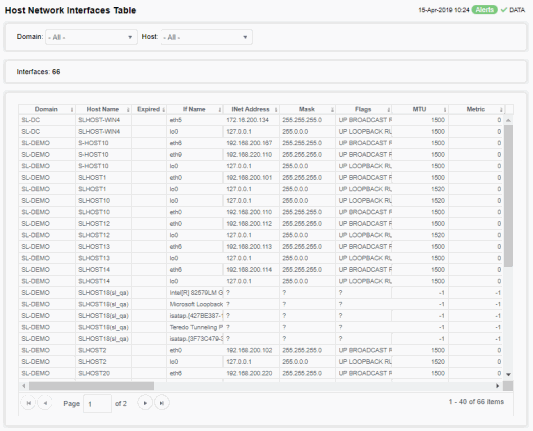
Investigate network interface card (NIC) utilization metrics and configuration details in one or all domains and on one or all hosts. This display contains all metrics available for network interfaces, including IP address, staus and RX/TX rates.
Each row in the table is a different NIC. Choose a domain or All Domains and a host or All Hosts from the drop-down menus. Click a column header to sort ascending or descending order.
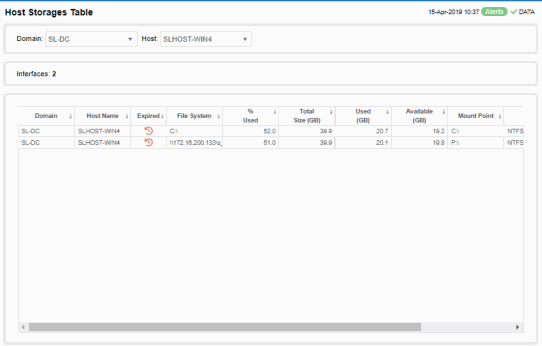
Host Storages
Investigate storage paritition utilization metrics and configuration details in one or all domains and on one or all hosts. This display contains all metrics available for storage parititions including storage size, amount of storage used and status.
Each row in the table is a different storage paritition. Choose a domain or All Domains and a host or All Hosts from the drop-down menus. Click a column header to sort ascending or descending order.
