Kafka Brokers View
These displays provide detailed data for all brokers in heatmap and tabular form, provide details for all metrics for a particular broker in tabular form, and provide JVM runtime and broker status details for a particular broker. Clicking Kafka Brokers from the left/navigation menu opens the Kafka Brokers Table display, which shows a tabular view of all brokers and their associated metrics. The options available under Kafka Brokers are:
| • | Brokers Heatmap: Opens the Kafka Brokers Heatmap display, which allows you to view performance metrics for all servers on a particular cluster. |
| • | Single Broker Summary: Opens the Kafka Single Broker Summary display, which contains JVM runtime data, broker status, topic, and topic trend details for a particular broker. |
| • | Single Broker JVM Runtime Summary: Opens the Kafka Single Broker JVM Runtime Summary display, which contains JVM runtime data for a single broker. |
| • | Single Broker Topics Summary: Opens the Kafka Single Broker Topics Summary display, which contains topic data for a single broker. |
| • | Single Broker Topics Lag Summary: Opens the Kafka Single Broker Topic Lag Summary display, which displays the lag per topic in a bar graph format and lists the lag per topic for the broker. |
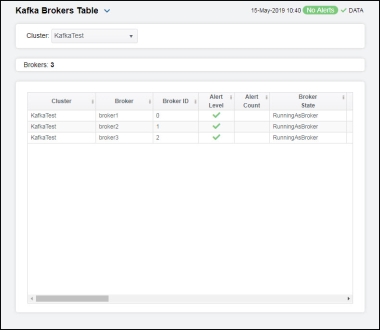
Kafka Brokers Table
The Kafka Brokers Table contains all metrics available for brokers, including partition data, purgatory data, and leader count. Each row in the table contains data for a particular broker. Click a column header to sort column data in ascending or descending order. Double-click on a table row to drill-down to the Kafka Single Broker Summary display and view metrics for that particular broker. Toggle between the commonly accessed displays by clicking the drop down list on the display title.
|
Filter By |
||||
|
|
Cluster |
Select the cluster for which you want to view data. |
||
|
Brokers |
Lists the number of brokers found as a result of the cluster that was selected and displayed in the Kafka Brokers table. |
|||
|
Kafka Brokers Table: |
||||
|
|
Cluster |
The name of the cluster. |
||
|
|
Broker |
The name of the broker. |
||
|
|
Broker ID |
The broker ID for the server. |
||
|
|
Alert Level |
The current alert severity.
|
||
|
|
Alert Count |
The total number of alerts for the host. |
||
|
|
Broker State |
The current state of the kafka broker.* |
||
|
|
Active Controller |
Denotes whether the broker is an active controller.* |
||
|
|
Leader Count |
The number of leaders on the broker.* |
||
|
|
Partitions |
The number of partitions on the broker.* |
||
|
|
Offline Partitions |
The number of partitions without an active leader on the broker.* |
||
|
|
Under Replicated Partitions |
The number of partition replicas that are out of sync (total number of replicas minus the total number of in-sync replicas) on the broker.* |
||
|
|
Preferred Replica Imbalance Count |
The number of topics whose replicas are not balanced on the broker.* |
||
|
|
Purgatory Size Fetch |
The number of fetch requests currently in purgatory (and waiting to be satisfied).* |
||
|
|
Purgatory Size Heartbeat |
The number of requests in purgatory due to failed heartbeat tests.* |
||
|
|
Purgatory Size Produce |
The number of produce requests currently in purgatory (and waiting to be satisfied).* |
||
|
|
Purgatory Size Rebalance |
The number of changes that need to be propagated to the replicas so that the partitions are no longer in purgatory.* |
||
|
|
Purgatory Size Topic |
The number of requests (based on topics) currently in purgatory.* |
||
|
|
Network Processor Avg % Idle |
The average fraction of time the network processors are idle.* |
||
|
|
Kafka Version |
The current version of Kafka.* |
||
|
|
JMX Connection String |
The JMX connection string used.* |
||
|
|
Connected? |
Denotes whether or not the broker is connected.* |
||
|
|
Expired |
When checked, performance data in the row has not been received within the time specified (in seconds) in the Expire Time field in the RTView Configuration Application > (KAFKAMON-LOCAL/Project Name) > Solution Package Configuration > Apache Kafka > DATA STORAGE > Duration > Expire Time property. The RTView Configuration Application > (KAFKAMON-LOCAL/Project Name) > Solution Package Configuration > Apache Kafka > DATA Storage > Duration > Delete Time property allows you to define the amount of time (in seconds) in which the row will be removed from the table if there is no response. For example, if Expire Time was set to 120 and Delete Time was set to 3600, then the Expired check box would be checked after 120 seconds and the row would be removed from the table after 3600 seconds. |
||
|
|
Timestamp |
The date and time the row data was last updated. |
||


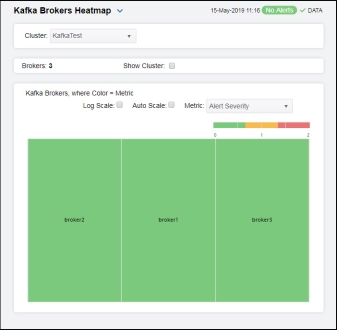
Kafka Brokers Heatmap
Clicking Brokers Heatmap in the left/navigation menu opens the Kafka Brokers Heatmap, which allows you to quickly identify the current status of each of your brokers for each available metric. You can view the brokers in the heatmap based on the following metrics: the current alert severity, the current alert count, the under replicated partitions count, the offline partitions count, the rate of incoming messages, the rate of incoming bytes, the rate of outgoing bytes, and the log flush latency value. By default, this display shows the heatmap based on the Alert Severity metric.
Each rectangle in the heatmap represents a broker. The rectangle color indicates the most critical alert state associated with the broker. Choose a cluster from the drop-down menu to view all brokers for that cluster. Choose a different metric to display from the Metric drop-down menu. Use the Show Cluster check-box  to include or exclude labels in the heatmap. Mouse over a rectangle to see additional metrics. By default, this display shows Alert Severity.
Drill-down and investigate a broker by clicking a rectangle in the heatmap to view details in the Kafka Single Broker Summary display.
|
Filter: |
||||
|
|
Cluster |
Select the cluster for which you want to view data. |
||
|
Fields and Data: |
||||
|
|
Brokers |
Displays the number of brokers found based on the filter and that are displayed int he heatmap. |
||
|
|
Show Cluster |
Select this check box to display the names of the cluster at the top of each rectangle in the heatmap. |
||
|
Heatmap |
||||
|
|
Log Scale |
Select this check box to enable a logarithmic scale. Use Log Scale to see usage correlations for data with a wide range of values. For example, if a minority of your data is on a scale of tens, and a majority of your data is on a scale of thousands, the minority of your data is typically not visible in non-log scale graphs. Log Scale makes data on both scales visible by applying logarithmic values rather than actual values to the data. |
||
|
|
Auto Scale |
Select to enable auto-scaling. When auto-scaling is activated, the color gradient bar's maximum range displays the highest value. Note: Some metrics auto-scale automatically, even when Auto Scale is not selected. |
||
|
|
Metric |
Select the metric driving the heatmap display. The default is Alert Severity. Each Metric has a color gradient bar that maps values to colors. The heatmap organizes the servers by host, where each rectangle represents a server. Mouse-over any rectangle to display the current values of the metrics for the broker. Click on a rectangle to drill-down to the associated Kafka Single Broker Summary display for a detailed view of metrics for that particular broker. |
||
|
|
|
Alert Severity |
The current alert severity. Values range from 0 - 2, as indicated in the color gradient
|
|
|
|
|
Alert Count |
The total number of critical and warning unacknowledged alerts in the brokers. The color gradient |
|
|
|
|
Under Replicated Partitions |
The number of under-replicated partitions. The color gradient When Auto Scale is checked, the numeric values in the color gradient bar show the range of the data being displayed rather than the default values. The middle value changes accordingly to indicate the color of the middle value of the range. |
|
|
|
|
Offline Partitions |
The number of offline partitions. The color gradient bar When Auto Scale is checked, the numeric values in the color gradient bar show the range of the data being displayed rather than the default values. The middle value changes accordingly to indicate the color of the middle value of the range. |
|
|
|
|
Msgs In Per Sec |
The rate of incoming messages (per second). The color gradient When Auto Scale is checked, the numeric values in the color gradient bar show the range of the data being displayed rather than the default values. The middle value changes accordingly to indicate the color of the middle value of the range. |
|
|
|
|
Bytes In Per Sec |
The rate of incoming bytes (per second). The color gradient When Auto Scale is checked, the numeric values in the color gradient bar show the range of the data being displayed rather than the default values. The middle value changes accordingly to indicate the color of the middle value of the range. |
|
|
|
|
Bytes Out Per Sec |
The rate of outgoing bytes (per second). The color gradient When Auto Scale is checked, the numeric values in the color gradient bar show the range of the data being displayed rather than the default values. The middle value changes accordingly to indicate the color of the middle value of the range. |
|
|
|
|
Log Flush Latency 95 Pct |
The log flush latency for the top five percent of values. The color gradient When Auto Scale is checked, the numeric values in the color gradient bar show the range of the data being displayed rather than the default values. The middle value changes accordingly to indicate the color of the middle value of the range. |
|


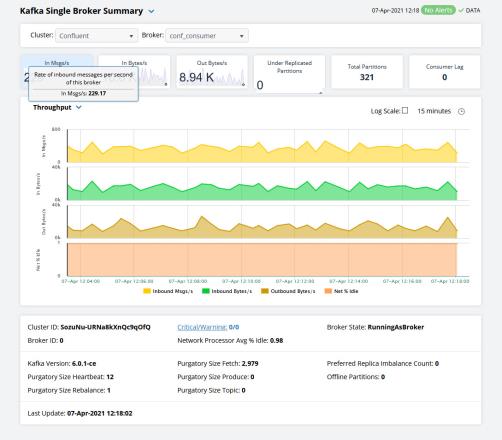
Kafka Single Broker Summary
Clicking Single Broker Summary in the left/navigation menu opens the Kafka Single Broker Summary display, which provides a view of the current and historical metrics for a single broker. Clicking on the information boxes at the top of the display takes you to the Kafka Brokers Table display, where you can view additional brokers data.
There are two options in the trend graph: Throughput and Partitions. In the Throughput option on the trend graph, you can view trend data for incoming message rate, incoming byte rate, outgoing byte rate, and net percentage idle over a selected time range. In the Partitions option on the trend graph, you can view trend data for partitions and active controllers over a selected time range.
Clicking the Critical/Warning link at the bottom of the display opens the Alerts Table by Component display.
Note: Fields/columns with an asterisk (*) at the end of the field/column definition contain data that is provided by the selected cluster. Refer to KAFKA documentation for more information regarding these fields.
|
Filter By: The display might include these filtering options: |
||||
|
|
Cluster |
Select the cluster for which you want to show data in the display. |
||
|
|
Broker |
Select the broker for which you want to show data in the display. |
||
|
Fields and Data |
||||
|
|
In Msgs/s |
The number of incoming messages per second. |
||
|
|
In Bytes/s |
The number of incoming bytes per second. |
||
|
|
Out Bytes/s |
The number of outgoing bytes per second. |
||
|
|
Under Replicated Partitions |
The number of partition replicas out of sync on the broker. |
||
|
|
Total Partitions |
The total number of partitions on the broker. |
||
|
|
Consumer Lag |
The aggregated consumer lag for all topics on the broker. |
||
|
Trend Graphs |
Throughput Inbound Msgs/s -- traces the number of incoming messages per second. Inbound Bytes/s -- traces the number of incoming bytes per second. Outbound Bytes/s -- traces the number of outgoing bytes per second. Net % Idle -- traces the average fraction of time the network processors are idle. Partitions Offline Partitions -- traces the number of offline partitions. Under Replicated Partitions -- traces the number of partition replicas out of sync on the broker. Active Controllers -- traces whether or not the broker is/was an active controller. |
|||
|
|
|
Log Scale |
Select to enable a logarithmic scale. Use Log Scale to see usage correlations for data with a wide range of values. For example, if a minority of your data is on a scale of tens, and a majority of your data is on a scale of thousands, the minority of your data is typically not visible in non-log scale graphs. Log Scale makes data on both scales visible by applying logarithmic values rather than actual values to the data. |
|
|
|
|
Time Settings |
Select a time range from the drop down menu varying from 5 Minutes to Last 7 Days. By default, the time range end point is the current time.
To change the time range, deselect the now toggle, which displays some additional date fields. You can click the left and right arrow buttons to decrease the end time by one time period (the time selected in the Time range drop down) per click, or you can choose the date and time from the associated calendar and clock icons. You can also enter the date and time in the text field using the following format: MMM dd, YYYY HH:MM:ss. For example, Aug 21, 2018 12:24 PM. Click the now toggle to reset the time range end point to the current time.
|
|
|
Cluster ID |
Lists the cluster’s globally unique identifier. Note: This field will not be populated for brokers running on Kafka Version 0.9.*, and the KafkaClusterSplitBrain alert will not work properly for those brokers. |
|||
|
Broker State |
The current state of the Kafka broker. |
|||
|
Network Processor Avg % Idle |
The average fraction of time the network processors are idle.* |
|||
|
Critical/Warning |
The number of critical and warning alerts. |
|||
|
Broker ID |
The broker ID for the server. |
|||
|
Kafka Version |
The current version of Kafka installed on the broker. |
|||
|
Preferred Replica Imbalance Count |
The number of topics whose replicas are not balanced on the broker.* |
|||
|
Purgatory Size Produce |
The number of produce requests currently in purgatory (and waiting to be satisfied).* |
|||
|
Purgatory Size Rebalance |
The frequency with which the partition rebalance check is triggered by the controller.* |
|||
|
Purgatory Size Fetch |
The number of fetch requests currently in purgatory (and waiting to be satisfied).* |
|||
|
Purgatory Size Heartbeat |
The number of requests in purgatory due to failed heartbeat tests.* |
|||
|
Offline Partitions |
The number of partitions on the broker that are currently offline.* |
|||
|
Purgatory Size Topic |
The number of requests (based on topics) currently in purgatory.* |
|||
|
Last Update |
The date and time of the last data update. |
|||

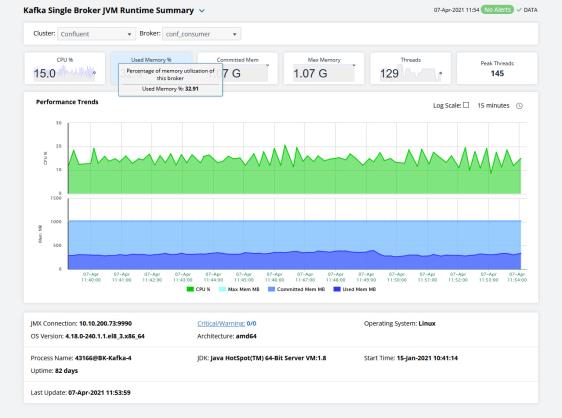
Kafka Single Broker JVM Runtime Summary
Clicking Single Broker JVM Runtimer Summary in the left/navigation menu opens the Kafka Single Broker JVM Runtime Summary display, which provides a view of the current and historical JVM Runtime metrics for a single broker. Clicking on the information boxes at the top of the display takes you to the Kafka Brokers Table display, where you can view additional brokers data.
There are two options in the trend graph: CPU and Threads and Heap Memory. In the CPU and Threads option on the trend graph, you can view trend data for CPU used percentage and number of threads over a selected time range. In the Heap Memory option on the trend graph, you can view trend data for the maximum available memory, the used memory, and the committed memory over a selected time range.
Clicking the Critical/Warning link at the bottom of the display opens the Alerts Table by Component display.
Note: Fields/columns with an asterisk (*) at the end of the field/column definition contain data that is provided by the selected cluster. Refer to KAFKA documentation for more information regarding these fields.
|
Filter By: The display might include these filtering options: |
||||
|
|
Cluster |
Select the cluster for which you want to show data in the display. |
||
|
|
Broker |
Select the broker for which you want to show data in the display. |
||
|
Fields and Data |
||||
|
|
JVM CPU % |
The percentage of CPU used of this broker as JVM. |
||
|
|
Used Memory % |
The percentage of memory used of this broker as JVM. |
||
|
|
Committed Mem MB |
The committed heap memory, in megabytes, of this broker as JVM. |
||
|
|
Max Memory MB |
The maximum heap memory, in megabytes, of this broker as JVM. |
||
|
|
Threads |
The number of threads running in the broker. |
||
|
|
Peak Threads |
The peak number of threads running in the broker. |
||
|
Trend Graphs |
CPU and Threads CPU % -- traces the percentage of CPU used of this broker as JVM. Threads -- traces the number of threads running in the broker. Heap Memory Max Mem MB-- traces the maximum heap memory, in megabytes, of this broker as JVM. Committed Mem MB -- traces the committed heap memory, in megabytes, of this broker as JVM. Used Mem MB -- traces the memory used by the broker. |
|||
|
|
|
Log Scale |
Select to enable a logarithmic scale. Use Log Scale to see usage correlations for data with a wide range of values. For example, if a minority of your data is on a scale of tens, and a majority of your data is on a scale of thousands, the minority of your data is typically not visible in non-log scale graphs. Log Scale makes data on both scales visible by applying logarithmic values rather than actual values to the data. |
|
|
|
|
Time Settings |
Select a time range from the drop down menu varying from 5 Minutes to Last 7 Days. By default, the time range end point is the current time.
To change the time range, deselect the now toggle, which displays some additional date fields. You can click the left and right arrow buttons to decrease the end time by one time period (the time selected in the Time range drop down) per click, or you can choose the date and time from the associated calendar and clock icons. You can also enter the date and time in the text field using the following format: MMM dd, YYYY HH:MM:ss. For example, Aug 21, 2018 12:24 PM. Click the now toggle to reset the time range end point to the current time.
|
|
|
JMX Connection |
The name of the JMX connection.* |
|||
|
Architecture |
The type of processor being used.* |
|||
|
Operating System |
The operating system installed on the broker.* |
|||
|
OS Version |
The version number of the operating system.* |
|||
|
Process Name |
The name of the process.* |
|||
|
Start Time |
The date and time when the broker was started.* |
|||
|
JDK |
The JDK version number.* |
|||
|
Uptime |
The amount of time the broker has been up and running.* |
|||
|
Last Update |
The date and time of the last data update. |
|||
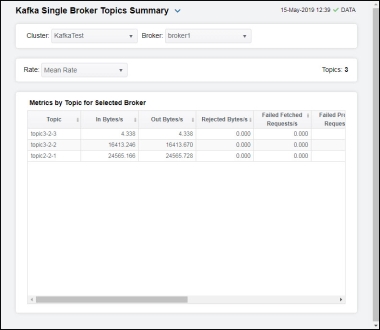
Kafka Single Broker Topics Summary
Clicking Single Broker Topics Summary in the left/navigation menu opens the Kafka Single Broker Topics Summary display, contains all metrics available for topics for a particular broker. Each row in the table contains data for a particular topic. Click a column header to sort column data in ascending or descending order. Double-click on a table row to drill-down to the Kafka Single Topic Summary display and view metrics for that particular topic. Toggle between the commonly accessed displays by clicking the drop down list on the display title.
|
Filter By: The display might include these filtering options: |
||||
|
|
Cluster |
Select the cluster for which you want to show data in the display. |
||
|
|
Broker |
Select the broker for which you want to show data in the display. |
||
|
|
Rate |
Select the option for which you want to view data. |
||
|
|
|
Mean Rate |
Select this option to view the average rate for each metric for the topics in the display. |
|
|
|
|
One Minute |
Select this option to view the 1 minute rate for each metric for the topics in the display. |
|
|
|
|
Five Minute |
Select this option to view the 5 minute rate for each metric for the topics in the display. |
|
|
|
|
Fifteen Minute |
Select this option to view the 15 minute rate for each metric for the topics in the display. |
|
|
|
Topics |
The total number of topics listed in the table. |
||
|
Metrics by Topic for Selected Broker Table |
||||
|
|
Topic |
Lists the name of the topic. |
||
|
|
In Bytes/s |
The rate of incoming bytes |
||
|
|
Out Bytes/s |
The rate of outgoing bytes. |
||
|
|
Rejected Bytes/s |
The rate of rejected bytes. |
||
|
|
Failed Fetch Requests/s |
The rate of failed fetch requests. |
||
|
|
Failed Produce Requests Per Sec |
The rate of failed produce requests. |
||
|
|
Fetched Msg Conversions/s |
The rate of fetched message conversions, per second. |
||
|
|
In Msgs/s |
The rate of incoming messages |
||
|
|
Produced Msgs Conversions/s |
The rate of produced message conversions, per second. |
||
|
|
Total Fetch Requests/s |
The rate of total fetch requests. |
||
|
|
Total Produce Requests/s |
The rate of total produce requests. |
||
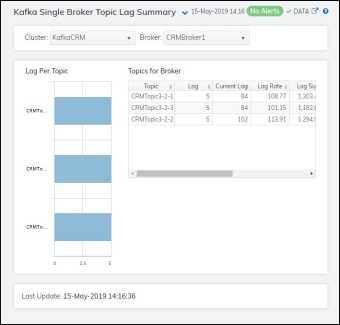
Kafka Single Broker Topic Lag Summary
Clicking Single Broker Topics Lag Summary in the left/navigation menu opens the Kafka Single Broker Topics Lag Summary display, which displays the lag per topic in a bar graph format and lists the lag per topic for the broker. Double-click on a bar graph to drill-down to the Kafka Single Broker Summary display and view metrics for that particular broker.
Each row in the table contains data for a particular topic. Click a column header to sort column data in ascending or descending order. Toggle between the commonly accessed displays by clicking the drop down list on the display title.
Note: Fields/columns with an asterisk (*) at the end of the field/column definition contain data that is provided by the selected cluster. Refer to KAFKA documentation for more information regarding these fields.
|
Filter By: The display might include these filtering options: |
||||
|
|
Cluster |
Select the cluster for which you want to show data in the display. |
||
|
|
Broker |
Select the broker for which you want to show data in the display. |
||
|
Lag Per Topic Bar Graph |
Displays the lag per topic in a bar graph format. |
|||
|
Topics for Broker Table |
||||
|
|
topic |
The name of the topic. |
||
|
|
Lag |
The difference between the current consumer position in the partition and the end of the log.* |
||
|
|
Current Lag |
The difference in the amount of lag from the previous polling period to the current polling period.* |
||
|
|
Lag Rate |
The rate of change in the amount of lag.* |
||
|
|
Log Size |
The current number of messages in the log.* |
||
|
|
Partitions |
The number of partitions containing the topic. |
||
|
|
Time Stamp |
The date and time the row data was last updated. |
||