Kafka Clusters View
These displays allow you to view metrics for all Kafka clusters and view the performance metrics for all servers on a particular cluster. Clicking Kafka Clusters from the left/navigation menu opens the Kafka Clusters Table display, which shows a tabular view of all clusters and their associated metrics. The option available under Kafka Clusters is:
| • | Cluster Performance: Opens the Kafka Single Cluster Performance display, which allows you to view performance metrics for all servers on a particular cluster. |
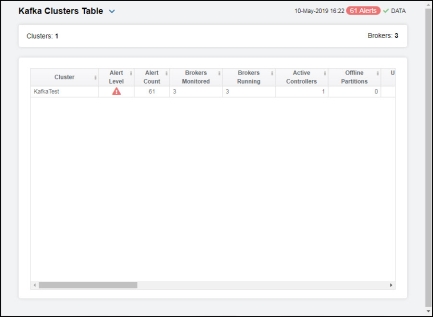
Kafka Clusters Table
The Kafka Clusters Table contains all metrics available for clusters, including broker, controller, offline partition, and zookeeper data. Each row in the table contains data for a particular cluster. Click a column header to sort column data in ascending or descending order. Double-click on a table row to drill-down to the Kafka Single Cluster Performance display and view metrics for that particular cluster. Toggle between the commonly accessed displays by clicking the drop down list on the display title.
|
Fields and Data: |
||||
|
|
Clusters |
Lists the number of brokers found as a result of the cluster that was selected and displayed in the Kafka Brokers table. |
||
|
Kafka Clusters Table: |
||||
|
|
Cluster |
The name of the cluster.* |
||
|
|
Alert Level |
The current highest alert severity for any of clusters.
|
||
|
|
Alert Count |
The total number of alerts for the host. |
||
|
|
Brokers Monitored |
The current number of brokers being monitored for the cluster.* |
||
|
|
Brokers Running |
The number of brokers currently running on the cluster.* |
||
|
|
Active Controllers |
The number of active controllers on the cluster.* |
||
|
|
Offline Partitions |
The number of partitions without an active leader on the cluster.* |
||
|
|
Under Replicated Partitions |
The number of partition replicas that are out of sync (total number of replicas minus the total number of in-sync replicas) on all brokers on the cluster.* |
||
|
|
% Max Deviation in Partitions |
The percentage of maximum deviation in partition count.* |
||
|
|
% Max Deviation in Leaders |
The percentage of maximum deviation in leader count.* |
||
|
|
Zookeepers |
The number of zookeepers on the cluster.* |
||
|
|
Alive Connections |
The number of connections on the zookeepers in the cluster.* |
||
|
|
Outstanding Requests |
The number of outstanding requests on the zookeepers in the cluster. |
||
|
|
Received Packets/s |
The rate of packets received on the zookeepers in the cluster.* |
||
|
|
Sent Packets/s |
The rate of packets sent by the zookeepers in the cluster.* |
||
|
|
Consumed Bytes/s |
The rate of bytes being consumed by the consumers. |
||
|
|
Consumed Records/s |
The rate of records being consumed by the consumers. |
||
|
|
Consumers |
The number of consumers on the cluster.* |
||
|
|
Producer In Bytes/s |
The rate of incoming bytes for the producers.* |
||
|
|
Producer Out Bytes/s |
The rate of outgoing bytes for the producers.* |
||
|
|
Producer Sent Records/s |
The rate of records being sent for the producers.* |
||
|
|
Producers |
The number of producers on the cluster. |
||


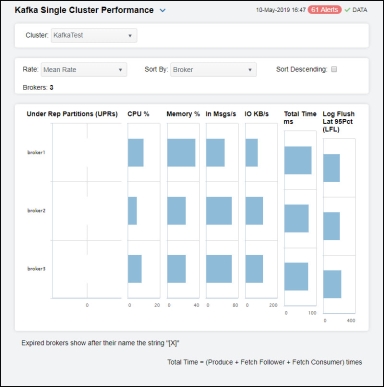
Kafka Single Cluster Performance
Clicking Cluster Performance in the left/navigation menu opens the Kafka Single Cluster Performance display, which allows you to view of the current metrics for the brokers contained in a selected cluster. The Rate drop down list, Sort By drop down list, and Sort Descending check box all determine the order in which data is displayed in the table. Select an option from the Rate drop down list to show data in the table based on the selected rate. Select the metric from the Sort By drop down list by which you want to sort the data in the display. When using this option with the Sort Descending toggle, the brokers (servers) will be sorted in ascending or descending order using the option you select from this drop down. For example, if you select In Msgs/s from this drop down and select the Sort Descending toggle, the servers listed in the display will be sorted so that the server with the most In Msgs/s will be listed at the top followed by the server with the next most In Msgs/s, and so on.
|
Filter By: The display might include these filtering options: |
||||
|
|
Cluster |
Select the cluster for which you want to show data in the display. |
||
|
|
Rate |
Specify the rate for which you want to show data in the display. |
||
|
|
Sort By |
Select the metric by which you want to sort the data in the display. When using this option with the Sort Descending toggle, the brokers (servers) will be sorted in ascending or descending order using the option you select from this drop down. For example, if you select InMsgs/s from this drop down and select the Sort Descending toggle, the servers listed in the display will be sorted so that the server with the most InMsgs/s will be listed at the top followed by the server with the next most InMsgs/s, and so on. |
||
|
|
Sort Descending |
When toggled on, the servers listed in the display are sorted in descending order based on the selected metric in the Sort By drop down. When toggled off, the servers are listed in ascending order. |
||
|
Fields and Data: |
||||
|
|
Brokers |
The number of brokers contained in the selected cluster. |
||
|
|
Under Rep Partitions (UPRs) |
Lists the number of partitions that are under-replicated or offline on each broker in the cluster. |
||
|
|
CPU % |
Lists the percentage of CPU used by the broker. |
||
|
|
Memory % |
Lists the percentage of memory used by the broker. |
||
|
|
In Msgs/s |
Lists the rate of incoming messages (per second) for each broker in the cluster. |
||
|
|
IO KB/s |
Lists the rate of incoming kilobytes (per second) for each broker in the cluster. |
||
|
|
Total Time ms |
Lists the total time (in milliseconds) taken to service a request.* |
||
|
|
Log Flush Latency 95Pct (LFL) |
Lists the 95th percentile value for the log flush latency for each broker on the cluster. |
||