Kafka Overview
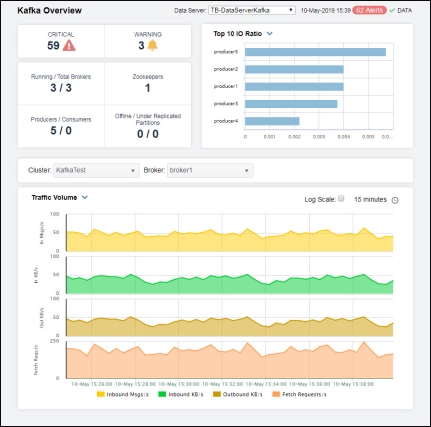
The Kafka Overview is the top-level display for the Kafka Monitor, which provides a good starting point for immediately getting the status of all your clusters, topics, brokers, zookeepers, producers, and consumers on your Data Server. You can select the RTView DataServer for which you want to see data and easily view the current data for that DataServer including:
|
•
|
The total number of active alerts for the selected DataServer, including the total number of critical and warning alerts. |
|
•
|
The number of running brokers and the total number of brokers. |
|
•
|
The number of zookeepers on your connected DataServer. |
|
•
|
The total number of producers and consumers. |
|
•
|
The number of offline and under-replicated partitions. |
|
•
|
A visual list of the top 10 servers containing the input/output ratio, inbound message rate, consumed kilobytes rate, received packets rate, sent packets rate, and log flush latency (95 percentile) on your connected DataServer. |
You can hover over each region in the upper half of the Overview to see more detail. You can also drill down to see even more detail by clicking on each respective region in the Overview. For example, clicking on the alerts in the CRITICAL and WARNING alerts region opens the Alerts Table by Components display.
The bottom half of the display provides a traffic volume and partition availability trend graph for a selected server. You can hover over the trend graph to see the values at a particular time. You can specify the time range for the trend graph and view data based on a log scale, which enables visualization on a logarithmic scale and should be used when the range in your data is very broad.
©2013-2024 Sherrill-Lubinski Corporation. All Rights Reserved.