Message Volume
You can view message volume history, aggregated by sum, in selectable time "buckets. Displays in this View are:
| • | Enabling the Message Volume Displays |
| • | Broker Message Volume |
| • | Broker Message Volume History |
| • | Bridge Message Volume |
| • | Bridge Message Volume History |
Important! These displays are only supported on systems where the RTView Historian is used with Oracle or MySQL. Additional configuration is required to enable the related RTView caches and database tables, described below.
Enabling the Message Volume Displays
Steps to enable the displays:
Step 1: Create required database table(s)
Create the database tables named SOL_VPN_TOTALS and SOL_BRIDGE_TOTALS, with two indexes. The syntax for these are in RTVAPM_HOME/rtvapm/solmon/dbconfig/, within the Oracle and MySQL schemas, and will get automatically created if you use those files to create your database tables.
Note: If you wish to use a custom database table name, do so when you create the database table in this step, and then make sure to follow Step 3 in this sequence.
Step 2: Enable the displays using a custom property
In the Configuration Application select the Solace Data Server. Then on the General/CUSTOM PROPERTIES tab, add the following custom properties. You can enable both, or only enable the Message Volume display for VPN or Bridge totals.
Name: sl.rtview.cache.config
Value: sol_cache_vpn_totals.rtv
Filter: collector
Comment: add caches to support time-bucket displays for Solace VPN message totals
Name: sl.rtview.cache.config
Value: sol_cache_bridge_totals.rtv
Filter: collector
Comment: add caches to support time-bucket displays for Solace Bridge message totals
These will add caches named SolVpnTotals and SolBridgeTotals to the system. For each unique broker and vpn, or broker, vpn, and bridge, the cache stores hourly totals of messages sent, messages received, bytes sent, and bytes received. The Data Historian stores the hourly totals in the SOL_VPN_TOTALS and SOL_BRIDGE_TOTALS database tables. After 30 days, the Historian compacts them into daily totals and keeps those for 9 months.
Step 3: (Optional) Customize the Database Table Name
The database table name(s) used by the Message Volume data can be customized. This step assumes you have created a database table in Step 1 that uses a name other than the default.
In the Configuration Application, select the Solace Data Server. Then on the General/CUSTOM PROPERTIES tab, add the following custom properties, replacing MY_TABLE_NAME with your unique table name(s).
Name: sl.rtview.sub
Value: $SOL_VPN_TOTALS_TABLE:'MY_TABLE_NAME'
Filter: collector
Comment: database table name for historical data from SolVpnTotals cache
Name: sl.rtview.sub
Value: $SOL_BRIDGE_TOTALS_TABLE:'MY_TABLE_NAME'
Filter: collector
Comment: database table name for historical data from SolBridgeTotals cache
Step 4: (Optional) Customize the Retention Period
With limitations, the compaction rules that determine the data retention of the Message Volume table can be customized. The default rule is '30d -;9M 1d'.
In the Configuration Application, select the Solace Data Server. Then on the General/CUSTOM PROPERTIES tab, add the following custom properties. '30d -;1y 1d' is used as an example.
Name: sl.rtview.sub
Value: $SOL_BRIDGE_TOTALS_COMPACTION:'30d -;1y 1d'
Filter: collector
Comment: keep daily totals from SolBridgeTotals cache for 1 year
Name: sl.rtview.sub
Value: $SOL_VPN_TOTALS_COMPACTION:'30d -;1y 1d'
Filter: collector
Comment: keep daily totals from SolVpnTotals cache for 1 year
Please note:
| • | The rule must be enclosed in single quotes (not double quotes or backquotes) |
| • | Only the 9M portion of the rule should be changed, to keep data for more than 9 months. For example specify 1y for 1 year. No other part of the rule should be changed, and the spaces and semicolon must be kept. If you make changes other than this, the time range and accuracy of the Message Volume History display could be impacted. |
| • | If you specify a retention period longer than 9 months, the maximum time range available on the Message Volume History display will still be 9 months. You will need to use another query tool to view data older than that. Also keep in mind that the database table will grow larger if the retention period is longer. |
Step 5: (Optional) Enable Grouping by Application Name
This functionality can be useful for assigning charges in cases where a VPN is shared by multiple applications.
Prerequisite(s): This functionality is only supported on systems where the RTView Historian is used with Oracle. It is not supported in MySQL at this time.
Step 5.1: Create a database table with the following schema and index:
CREATE TABLE "SOL_VPN_APPS" ("Connection" VARCHAR(100), "vpn-name" VARCHAR(100), "app-name" VARCHAR(100)) TABLESPACE "USERS";
CREATE INDEX "rtvpk_sol_vpn_apps" ON "SOL_VPN_APPS" ("Connection","vpn-name","app-name");
A table name other than SOL_VPN_APPS can be used, as described in the next step. But the column names above must be used.
Step 5.2: Populate the table with the VPN-to-application assignments for your system. The table contains one row for each unique Broker (Connection), vpn-name, and app-name.
Example:
Say there are four apps named Blue, Green, Red, and Yellow.
Say the Blue, Green, and Red apps share a vpn named V-101 on broker BR-01.
Say the Blue and Yellow apps share another vpn named V-202 on broker BR-02
In that case the database table should contain these 5 rows:
| Connection | vpn-name | app-name |
| BR-01 | V-101 | Blue |
| BR-01 | V-101 | Green |
| BR-01 | V-101 | Red |
| BR-02 | V-202 | Blue |
| BR-02 | V-202 | Yellow |
Step 5.3: In the Config UI, select the Solace Data Server. Then on the General/CUSTOM PROPERTIES tab, add the following custom property:
Name: sl.rtview.sub
Value: $SOL_VPN_APP_TABLE:SOL_VPN_APPS
Filter: collector
Comment: name of db table to support group by app on message vol history display
The value field must contain $SOL_VPN_APP_TABLE: followed by the name of the database table created in Step 5.1 (SOL_VPN_APPS in this example).
Step 6: Restart the Solace Data Server and the Central Data Server
In the HTML Monitor UI, the navigation tree
Broker Message Volume
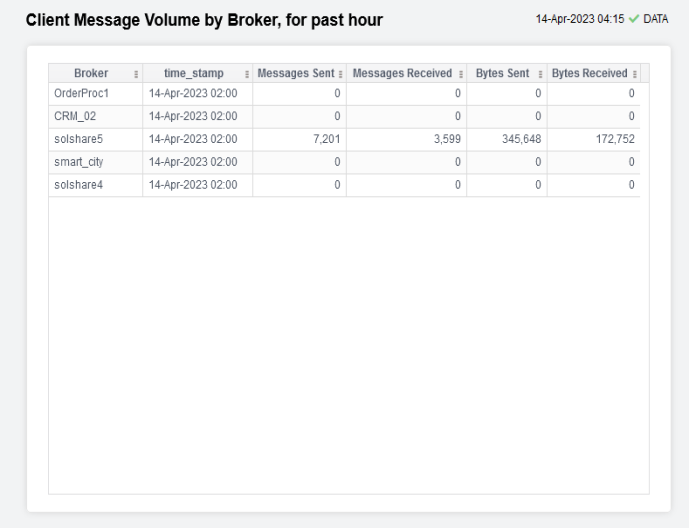
The Broker Message Volume displays contains a table with one row for each broker, with columns containing hourly totals of Messages Sent, Messages Received, Bytes Sent, and Bytes Received.
Note: The totals are computed for the previous hour, so the table may be empty for as long as one hour after startup!
Click a column header to sort column data in numerical or alphabetical order. Search by clicking the right side of a column heading Filter to open the Search, Sort and Choose Columns dialog:
Double-click a row to drill down for that broker to the Broker Message Volume History display.
|
|
Broker |
The name of the broker. |
||
|
|
Time Stamp |
The date and time the row data was last updated. |
||
|
|
Messages Sent |
The total number of messages sent in the previous hour |
||
|
|
Message Received |
The total number of messages received in the previous hour |
||
|
|
Byte Sent |
The total number of bytes sent in the previous hour for |
||
|
|
Bytes Received |
The total number of bytes received in the previous hour |
||
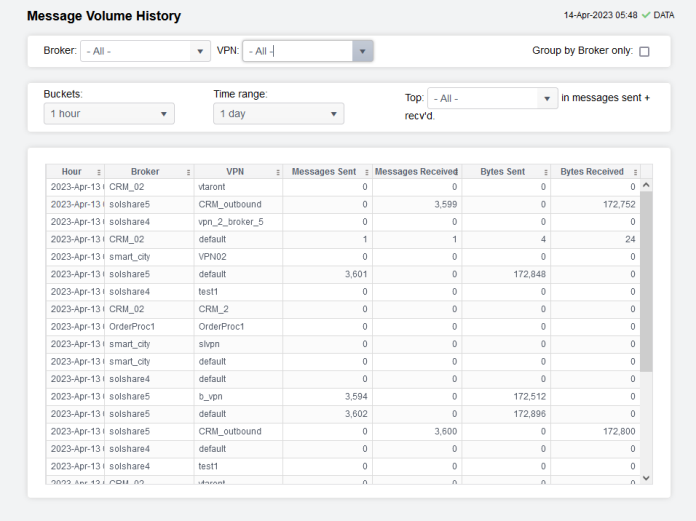
Broker Message Volume History
Important! This display is supported only on systems where the RTView Historian is used with Oracle or MySQL.
The table in this display executes SQL queries on the SOL_VPN_TOTALS database table.
The user can select the following:
- Broker and VPN name(s) of interest, using specific names or patterns with * as wildcard
- Buckets:a time bucket between 1 hour and 1 month
- Time Range: a time range between 1 day and 9 months, depending on the selected time bucket. The time range queried for the display will be the Time range selected plus the current day.
- Top: an option to display the rows for the top N totals only, or all rows
- Group by Broker only: an option to aggregate the totals by Broker + VPN, or by Broker only
The selected options are used to construct a "Group By" query to be performed on the RTVHISTORY database in Oracle or MySQL.
Note: A new database table will be empty initially. Data for each of the selectable time ranges (1 day, 7 days, 1 month, etc) won't be available until the system has been configured and collecting data for that amount of time.
Depending on the options selected by the user, the query result can be large and may take some time to complete. This query has a 60 second timeout. Queries involving only a few Broker + VPN combinations and a short time range will be smaller and faster than those involving many combinations and longer time ranges. Choosing a value other than ALL for the Top option (e.g. Top = 10) will make a query that returns only the rows with the top 10 total messages sent and received, and may give a faster response.
Note: For performance reasons each query result is limited to 100k rows.
Tip: The user can right click on the table in the Message Volume History display and select Copy query string from the popup menu. This will copy the SQL query string to the clipboard which can be useful for executing the same query in an external tool such as Oracle sqlplus.
|
|
Hour |
The date and hour of the selected computed message volume. |
||
|
|
Broker |
The name of the broker. |
||
|
|
VPN |
The name of the VPN, if Group by Broker is not selected. |
||
|
|
Messages Sent |
The total number of messages sent during the selected time bucket for a given Broker (and VPN, if Group by Broker is not selected) |
||
|
|
Message Received |
The total number of messages received during the selected time bucket for a given Broker (and VPN, if Group by Broker is not selected) |
||
|
|
Byte Sent |
The total number of bytes sent during the selected time bucket for a given Broker (and VPN, if Group by Broker is not selected) |
||
|
|
Bytes Received |
The total number of bytes received during the selected time bucket for a given Broker (and VPN, if Group by Broker is not selected) |
||
Grouping by Application (Optional)
If enabled (see Step 5: (Optional) Enable Grouping by Application Name ), a combo-box labeled App: will be available near the top right corner.

The user can pick an app name from the dropdown list, or enter an app name with wildcards. Then the Messages Sent / Received columns will show the totals for the selected app(s) for each selected VPN that is assigned to the app(s). If a VPN is shared by N apps, the totals shown are divided by N. If a VPN is not used by the selected app(s), it is not shown in the table. By default the App combobox is empty, meaning that no grouping by app is performed, and the display ignores this functionality.
If a value other than <blank> is specified for App:, an App column will appear in the table after VPN.
Note: Grouping by Broker is not compatible with Grouping by Application name. Selecting the Broker only: checkbox will set the App name to <blank> and the App: combo-box will be disabled.
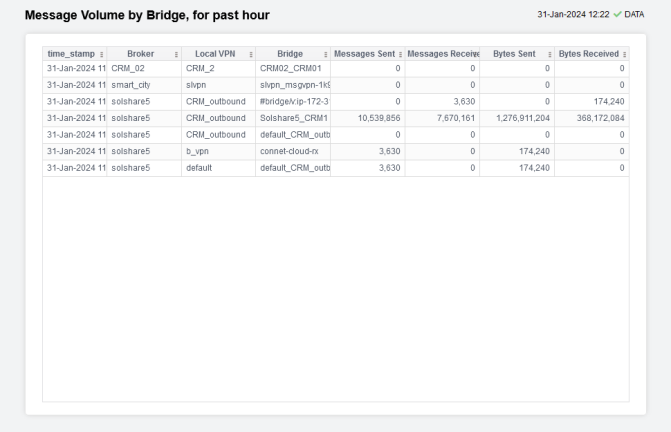
Bridge Message Volume
The Broker Message Volume displays contains a table with one row for each bridge, with columns containing hourly totals of Messages Sent, Messages Received, Bytes Sent, and Bytes Received.
Note: The totals are computed for the previous hour, so the table may be empty for as long as one hour after startup!
Click a column header to sort column data in numerical or alphabetical order. Search by clicking the right side of a column heading Filter to open the Search, Sort and Choose Columns dialog:
Double-click a row to drill down for that broker to the Bridge Message Volume History display.
|
|
Time Stamp |
The date and time the row data was last updated. |
|
|
Broker |
The name of the broker. |
|
|
Local VPN |
The name of the VPN. |
|
|
Bridge |
The name of the bridge. |
|
|
Messages Sent |
The total number of messages sent in the previous hour |
|
|
Message Received |
The total number of messages received in the previous hour |
|
|
Byte Sent |
The total number of bytes sent in the previous hour for |
|
|
Bytes Received |
The total number of bytes received in the previous hour |
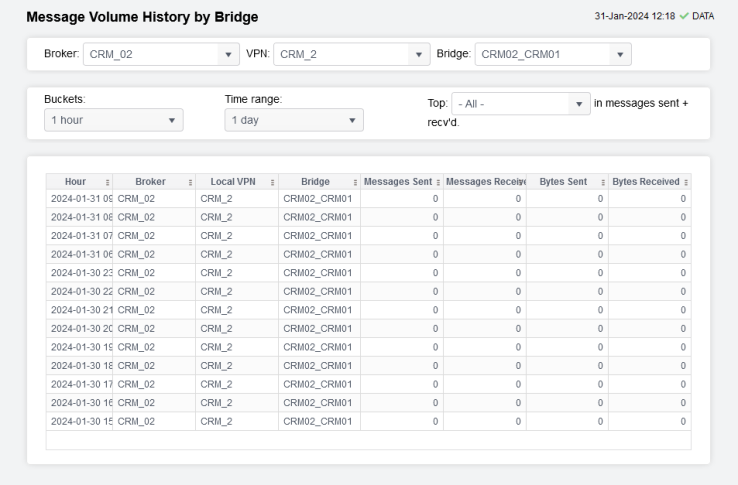
Bridge Message Volume History
Important! This display is supported only on systems where the RTView Historian is used with Oracle or MySQL.
The table in this display executes SQL queries on the SOL_BRIDGE_TOTALS database table.
The user can select the following:
- Broker, Local VPN name(s), and Bridge name(s) of interest, using specific names or patterns with * as wildcard
- Buckets:a time bucket between 1 hour and 1 month
- Time Range: a time range between 1 day and 9 months, depending on the selected time bucket. The time range queried for the display will be the Time range selected plus the current day.
- Top: an option to display the rows for the top N totals only, or all rows
The selected options are used to construct a "Group By" query to be performed on the RTVHISTORY database in Oracle or MySQL.
Note: A new database table will be empty initially. Data for each of the selectable time ranges (1 day, 7 days, 1 month, etc) won't be available until the system has been configured and collecting data for that amount of time.
Depending on the options selected by the user, the query result can be large and may take some time to complete. This query has a 60 second timeout. Queries involving only a few Broker + VPN + Bridge combinations and a short time range will be smaller and faster than those involving many combinations and longer time ranges. Choosing a value other than ALL for the Top option (e.g. Top = 10) will make a query that returns only the rows with the top 10 total messages sent and received, and may give a faster response.
Note: For performance reasons each query result is limited to 100k rows.
Tip: The user can right click on the table in the Message Volume History by Bridge display and select Copy query string from the popup menu. This will copy the SQL query string to the clipboard which can be useful for executing the same query in an external tool such as Oracle sqlplus.
|
|
Hour |
The date and hour of the selected computed message volume. |
|
|
Broker |
The name of the broker. |
|
|
Local VPN |
The name of the VPN. |
|
|
Bridge |
The name of the bridge. |
|
|
Messages Sent |
The total number of messages sent during the selected time bucket for a given Broker (and VPN, if Group by Broker is not selected) |
|
|
Message Received |
The total number of messages received during the selected time bucket for a given Broker (and VPN, if Group by Broker is not selected) |
|
|
Byte Sent |
The total number of bytes sent during the selected time bucket for a given Broker (and VPN, if Group by Broker is not selected) |
|
|
Bytes Received |
The total number of bytes received during the selected time bucket for a given Broker (and VPN, if Group by Broker is not selected) |