BE Concepts
These displays present performance metrics and alert status for your BusinessEvents concepts. Clicking BE Concepts from the left/navigation menu opens the TIBCO BE Concepts Table display, which shows all available utilization metrics for all BE concepts. The options available under BE Concepts are:
| • | Concept Hit Summary: Opens the TIBCO BE Concept Hit Summary , which shows details and alert status for a BE concept. |
| • | Channels: Opens the TIBCO BE Channel Status Table display, which shows information for destinations and channels for a single BE node. |
| • | Inference Agents Table: Opens the TIBCO BE Inference Agents Table display, which displays agents data for a specific cluster. |
| • | RTC Reports Table: Opens the TIBCO BE RTC Txn Manager Reports display, which displays reports data for a specific cluster. |
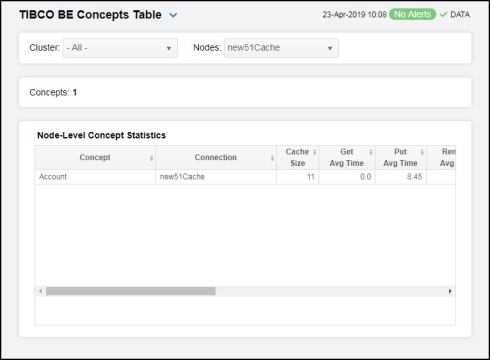
TIBCO BE Concepts Table
View a list of concepts and their run-time statistics. Choose a single cluster or All Clusters and a node from the drop-down menus. Double-clicking on a row in the table displays additional details as well as hit rates and current hits over time for the concept in the TIBCO BE Concept Hit Summary display. Each row in the table contains data for a particular concept. Click a column header to sort column data in ascending or descending order. Toggle between the commonly accessed Table and Summary displays by clicking the drop down list on the display title.
|
Filter By: The display might include these filtering options: |
||||
|
|
Cluster: |
Choose a cluster to see metrics for. |
||
|
|
Nodes: |
Choose a node to see metrics for. |
||
|
Concepts: |
The total number of concepts in the table. |
|||
|
Node-Level Concept Statistics Table: Each row in the table provides statistics regarding data access for a given BusinessEvents concept. Note: Row columns in this table with an asterisk (*) at the end of the column definition contain data that is provided by the TIBCO MBean interface. Refer to TIBCO documentation for more information regarding these columns. |
||||
|
|
Concept |
The name of the concept. |
||
|
|
Connection |
The name of the connection. |
||
|
|
Cache Size |
The size of the concept’s cache.* |
||
|
|
Get Avg Time |
The average time taken for a “get” operation.* |
||
|
|
Put Avg Time |
The average time taken for a “put” operation.* |
||
|
|
Remove Avg Time |
The average time taken for a “remove” operation.* |
||
|
|
Gets/s |
The rate of “gets” for the concept. |
||
|
|
Puts/s |
The rates of “puts” for the concept. |
||
|
|
Removes/s |
The rate of “removes” for the concept. |
||
|
|
Get Count |
The total number of “gets” for the concept.* |
||
|
|
Put Count |
The total number of “puts” for the concept.* |
||
|
|
Remove Count |
The total number of “removes” for the concept.* |
||
|
|
Num Handles In Store |
The number of handles in the Backing Store for the concept.* |
||
|
|
Expired |
When checked, performance data has not been received within the time specified (in seconds) in the Expire Time field in the Duration region in the RTView Configuration Application > (Project Name) > Solution Package Configuration > TIBCO BusinessEvents > DATA STORAGE tab. The Delete Time field (also in the Duration region) allows you to define the amount of time (in seconds) in which the row will be removed from the table if there is no response. |
||
|
|
Time Stamp |
The date and time, relative to the Data Server, that data was last collected for the concept. |
||
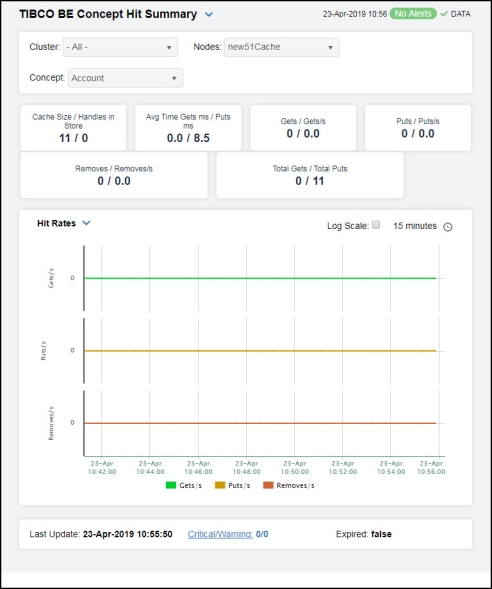
TIBCO BE Concept Hit Summary
Clicking Concept Hit Summary in the left/navigation menu opens the TIBCO BE Concept Hit Summary display, which allows you to view current and historic data for a single concept. Data in this display can be useful if your BusinessEvents system uses Cache object management. When Cache object management is used, concepts with a sufficiently long time to live (TTL) setting are cached.
Cache reference patterns for certain concepts may be related to incoming events (for example, customer purchase orders with associated inventory queries). The trend charts show the cache activity of such concepts, and might be useful in diagnosing the behavior of your application over time.
There are two options in the trend graph region: Hit Rates and Current Hits. In the Hit Rates trend graph region, you can view the number of “get” operations per second, the number of “put” operations per second, and the number of “remove” operations per second over a selected time range. In the Current Hits trend graph region, you can view the number of “get” operations, the number of “put” operations, and the number of “remove” operations over a selected time range. Clicking the Critical/Warning link at the bottom of the display opens the Alerts Table by Component display.
|
Filter By:
|
||||
|
|
Cluster: |
Select a cluster containing the node and concept for which you want to view metrics. |
||
|
|
Nodes: |
Select a node containing the concept for which you want to view metrics. |
||
|
|
Concept |
Select the concept for which you want to view metrics. |
||
|
Fields and Data: Note: Fields in this table with an asterisk (*) at the end of the field definition contain data that is provided by the TIBCO MBean interface. Refer to TIBCO documentation for more information regarding these fields. |
||||
|
|
Cache Size/Handles in Store |
The size of the cache, and the number of handles in the Backing Store.* |
||
|
|
Avg Time Gets ms /Puts ms |
The average cache access time taken for a “get” operation (in milliseconds), and the average cache access time taken for a “put” operation (in milliseconds).* |
||
|
|
Gets/ Gets/s |
The number of cache accesses for “get” operations for the concept, and the rate of “get” operations for the concept. |
||
|
|
Puts/ Puts/s |
The number of cache accesses for “put” operations for the concept, and the rate of “put” operations for the concept. |
||
|
|
Removes/ Removes/s |
The number of cache accesses for “remove” operations for the concept, and the rate of “remove” operations for the concept. |
||
|
|
Total Gets/ Total Puts |
The total number of cache accesses for “get” operations for the concept, and the total number of cache accesses for “put” operations for the concept. |
||
|
Trend Graphs |
Hit Rates Shows metrics for the selected cluster/node/concept combination: Gets/s -- Traces the rate of “get” operations for the concept. Puts(/sec)-- Traces the rate of “put” operations for the concept. Removes(/sec)-- Traces the rate of “remove” operations for the concept. Current Hits Shows metrics for the selected cluster/node/concept combination: Gets(/sec) -- Traces the number of “get” operations for the concept. Puts(/sec)-- Traces the number of “put” operations for the concept. Removes(/sec)-- Traces the number of “remove” operations for the concept. |
|||
|
|
|
Use Rates |
When selected, this toggle allows you to view data in the trend graph in counts per second (“get” operations count per second, “put” operations count per second, and “remove” operations count per second) instead of the default counts per selected interval (“get” operations count, “put” operations count, “remove” operations count). |
|
|
|
|
Log Scale |
This option should be used when the range of your data is very broad. When checked, the values are displayed using a logarithmic scale rather than using the actual values so that data on the extreme ends of the scale can be viewed more effectively. For example, if you have data that ranges from the tens to the thousands, the data in the range of the tens will be neglected visually if you do not check this option.
|
|
|
|
|
Time Settings |
Select a time range from the drop down menu varying from 5 Minutes to Last 7 Days. By default, the time range end point is the current time.
To change the time range, deselect the now toggle, which displays some additional date fields. You can click the left and right arrow buttons to decrease the end time by one time period (the time selected in the Time range drop down) per click, or you can choose the date and time from the associated calendar and clock icons. You can also enter the date and time in the text field using the following format: MMM dd, YYYY HH:MM:ss. For example, Aug 21, 2018 12:24 PM. Click the now toggle to reset the time range end point to the current time.
|
|
|
|
Last Update |
The date and time in which the data was last updated in the display. |
||
|
|
Critical/ Warning |
The number of critical and warning alerts. |
||
|
|
Expired |
When true, performance data has not been received within the time specified (in seconds) in the Expire Time field in the Duration region in the RTView Configuration Application > (Project Name) > Solution Package Configuration > TIBCO BusinessEvents > DATA STORAGE tab. The Delete Time field (also in the Duration region) allows you to define the amount of time (in seconds) in which the row will be removed from the table if there is no response. |
||
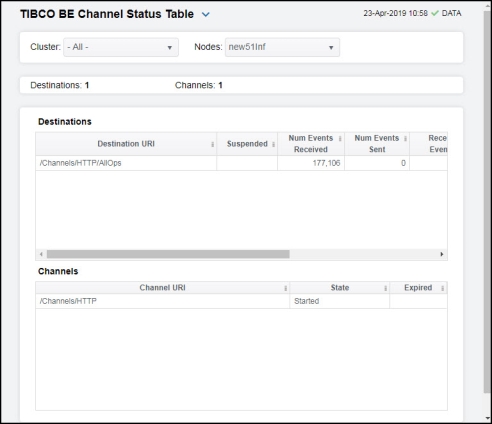
TIBCO BE Channel Status Table
Clicking Channels in the left/navigation menu opens the TIBCO BE Channel Status Table display, which allows you to view a list of destinations, which are sources and sinks of events, and Channels. Destinations are potentially bi-directional, and the table indicates whether events are sent or received. Channels provide a class wrapper for destinations, and make it possible to enable or disable a group of destinations with one operation.
Click a column header to sort column data in ascending or descending order. Toggle between the commonly accessed Table and Summary displays by clicking the drop down list on the display title.
|
Filter By: The display might include these filtering options: |
||||
|
|
Cluster: |
Choose a cluster to see metrics for. |
||
|
|
Nodes: |
Choose a node to see metrics for. |
||
|
Destinations: |
The total number of destinations in the table. |
|||
|
Channels: |
The total number of channels in the table. |
|||
|
Destinations Table Each row in the able provides data for a particular destination. Note: Row columns in this table with an asterisk (*) at the end of the column definition contain data that is provided by the TIBCO MBean interface. Refer to TIBCO documentation for more information regarding these columns. |
||||
|
|
Destination URI |
The Uniform Resource Identifier (URI) for the destination.* |
||
|
|
Suspended |
Denotes whether the destination is suspended.* |
||
|
|
Num Events Received |
The number of events received by the destination.* |
||
|
|
Number of Events Sent |
The number of events sent by the destination.* |
||
|
|
Received Events/s |
The rate of events received by the destination. |
||
|
|
Received Events Last Interval |
The rate of events received since the last data update. |
||
|
|
Expired |
When checked, performance data has not been received within the time specified (in seconds) in the Expire Time field in the Duration region in the RTView Configuration Application > (Project Name) > Solution Package Configuration > TIBCO BusinessEvents > DATA STORAGE tab. The Delete Time field (also in the Duration region) allows you to define the amount of time (in seconds) in which the row will be removed from the table if there is no response. |
||
|
|
Time Stamp |
The date and time, relative to the Data Server, that data was last collected for the destination. |
||
|
Channels Table Each row in the able provides data for a particular channel. Note: Row columns in this table with an asterisk (*) at the end of the column definition contain data that is provided by the TIBCO MBean interface. Refer to TIBCO documentation for more information regarding these columns. |
||||
|
|
Channel URI |
The Uniform Resource Identifier (URI) for the channel.* |
||
|
|
State |
The current state of the channel.* |
||
|
|
Expired |
When checked, performance data has not been received within the time specified (in seconds) in the Expire Time field in the Duration region in the RTView Configuration Application > (Project Name) > Solution Package Configuration > TIBCO BusinessEvents > DATA STORAGE tab. The Delete Time field (also in the Duration region) allows you to define the amount of time (in seconds) in which the row will be removed from the table if there is no response. |
||
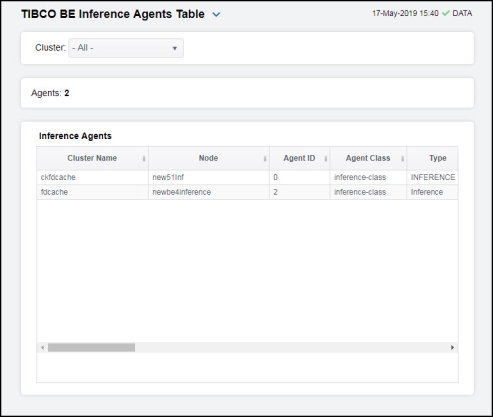
TIBCO BE Inference Agents Table
Clicking Inference Agents Table in the left/navigation menu opens the TIBCO BE Inference Agents Table display, which allows you to compare agent metrics across deployed engines and verify that the cluster is properly load-balanced. View a list of all the inference agents deployed in each cluster. You can view agent data for a single cluster or all clusters.
The data in this display is identical to the data provided for a single engine in the TIBCO BE Cluster Summary display, except that it is aggregated across all inference nodes.
Choose a single cluster or All clusters from the drop-down menu. Each row in the table is a different agent.
|
Filter By: The display might include these filtering options: |
||||
|
|
Cluster: |
Select the cluster for which you want to see metrics, or select All Clusters to see metrics for all clusters. |
||
|
Agents: |
The number of agents currently in the table. |
|||
|
Inference Agents Table Each row in the table provides details for an agent. Note: Row columns in this table with an asterisk (*) at the end of the column definition contain data that is provided by the TIBCO MBean interface. Refer to TIBCO documentation for more information regarding these columns. |
||||
|
|
Cluster Name |
The name of the TIBCO BusinessEvents cluster. |
||
|
|
Node |
The name of the node. |
||
|
|
Agent ID |
A unique string that identifies the agent. |
||
|
|
Agent Class |
The name of the agent’s class. |
||
|
|
Type |
The type of agent (Inference, Cache, Query, or Dashboard).* |
||
|
|
Current State |
The current state of the agent.* |
||
|
|
Started |
When checked, denotes that the agent is started.* |
||
|
|
Suspended |
When checked, denotes that the agent is suspended.* |
||
|
|
Concurrent |
When checked, denotes that it is a concurrent agent.* |
||
|
|
Queue Capacity |
The queue capacity for the agent.* |
||
|
|
Queue Size |
The queue size for the agent.* |
||
|
|
Thread Count |
The total number of threads for the agent.* |
||
|
|
Total # Rules Fired |
The total number of rules fired for the agent.* |
||
|
|
Rules/s |
The rate of rules fired for the agent. |
||
|
|
Avg Receive Time |
See TIBCO documentation for more information.* |
||
|
|
Avg Txn Commit Time |
The average amount of time taken to commit a transaction.* |
||
|
|
Cache Queue Remaining |
The total amount of remaining space on the cache queue.* |
||
|
|
DB Ops Queue Remaining |
The total amount of remaining space on the DB Operations queue.* |
||
|
|
Hit Ratio |
See TIBCO documentation for more information.* |
||
|
|
Job Rate |
See TIBCO documentation for more information.* |
||
|
|
L1 Cache Max Size |
The maximum size of the L1 cache.* |
||
|
|
L1 Cache Size |
The current size of the L1 cache.* |
||
|
|
Max Active |
See TIBCO documentation for more information.* |
||
|
|
# Event Threads |
The total number of currently active event threads.* |
||
|
|
# Jobs |
The total number of currently active jobs.* |
||
|
|
Priority |
See TIBCO documentation for more information.* |
||
|
|
Read Only |
See TIBCO documentation for more information.* |
||
|
|
Txn Commit Count |
The number of transactions committed by the agent.* |
||
|
|
Txn Receive Count |
The number of transactions received by the agent.* |
||
|
|
Expired |
When checked (true), performance data has not been received within the time specified (in seconds) in the Expire Time field in the Duration region in the RTView Configuration Application > (Project Name) > Solution Package Configuration > TIBCO BusinessEvents > DATA STORAGE tab. The Delete Time field (also in the Duration region) allows you to define the amount of time (in seconds) in which the row will be removed from the table if there is no response. |
||
|
|
Time Stamp |
The date and time, relative to the Data Server, that data was last collected for the destination. |
||
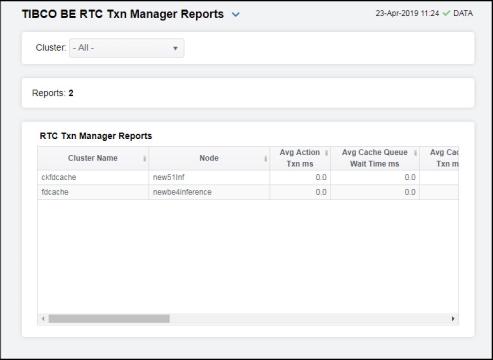
TIBCO BE RTC Txn Manager Reports
Clicking RTC Reports Table in the left/navigation menu opens the TIBCO BE RTC Txn Manager Reports display, which allows you to compare RTC metrics across deployed engines. View a list of all the inference engine RTC reports. You can view reports for a single cluster or all clusters. The data in this display is identical to the data provided for a single engine in the TIBCO BE Cluster Summary display, except that it is aggregated across all inference nodes.
|
Filter By: The display might include these filtering options: |
||||
|
|
Cluster: |
Select the cluster for which you want to see metrics, or select All Clusters to see metrics for all clusters. |
||
|
Reports: |
The number of reports currently in the table. |
|||
|
RTC Txn Manager Reports Table Each row in the table is a different report. Data in the row columns describe the report. Note: Row columns in this table with an asterisk (*) at the end of the column definition contain data that is provided by the TIBCO MBean interface. Refer to TIBCO documentation for more information regarding these columns. |
||||
|
|
Cluster Name |
The name of the TIBCO BusinessEvents cluster. |
||
|
|
Node |
The name of the node. |
||
|
|
Avg Action Txn ms |
The average amount of time taken for an action transaction, in milliseconds.* |
||
|
|
Avg Cache Queue Wait Time ms |
The average cache queue wait time, in milliseconds.* |
||
|
|
Avg Cache Txn ms |
The average amount of time taken for a cache transaction, in milliseconds.* |
||
|
|
Avg DB Ops Batch Size |
The average database operation batch size.* |
||
|
|
Avg DB Queue Wait Time ms |
The average database queue wait time, in milliseconds.* |
||
|
|
Avg DB Txn ms |
The average amount of time taken for a database transaction, in milliseconds.* |
||
|
|
Avg Successful Txn Time ms |
The average amount of time taken for a successful transaction, in milliseconds.* |
||
|
|
Last DB Batch Size |
The size of the last database batch.* |
||
|
|
Pending Actions |
The total number of pending actions.* |
||
|
|
Pending Cache Writes |
The total number of pending cache writes.* |
||
|
|
Pending DB Writes |
The total number of pending database writes.* |
||
|
|
Pending Events to Ack |
The total number of pending events that need to be acknowledged.* |
||
|
|
Pending Locks to Release |
The total number of pending locks that need to be released.* |
||
|
|
Total DB Txns Completed |
The total number of database transactions that have been completed.* |
||
|
|
Total Successful Txns |
The total number of successful transactions.* |
||
|
|
Total Errors |
The total number of errors.* |
||
|
|
Expired |
When checked, performance data has not been received within the time specified (in seconds) in the Expire Time field in the Duration region in the RTView Configuration Application > (Project Name) > Solution Package Configuration > TIBCO BusinessEvents > DATA STORAGE tab. The Delete Time field (also in the Duration region) allows you to define the amount of time (in seconds) in which the row will be removed from the table if there is no response. |
||
|
|
Time Stamp |
The date and time, relative to the Data Server, that data was last collected for the destination. |
||