BW5 Engines
These displays present performance metrics and alert status for all BW5 engines. Clicking BW5 Engines from the left/navigation menu opens the TIBCO BusinessWorks 5 Engines Table display, which shows all available utilization metrics for all BW5 engines. The options available under BW5 Engines are:
| • | All Engines Heatmap: Opens the TIBCO BusinessWorks 5 Engines Heatmap , which shows engine and alert status for all BW5 servers. |
| • | BW5 Engine Summary: Opens the TIBCO BusinessWorks 5 Engine Summary display, which shows information for a single BW5 engine. |
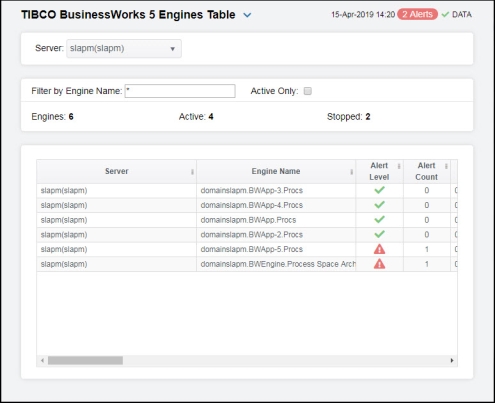
TIBCO BusinessWorks 5 Engines Table
Investigate detailed utilization metrics for all BW engines. The TIBCO BusinessWorks 5 Engines Table contains all metrics available for engines, including memory usage, memory used percentage, and CPU used percentage. You can enter a string in the Filter by Engine Name field to show only engines in the table with names that contain the string. For example, if you enter the string Madrid, all engines with Madrid in the engine name are shown in the table. If no entry is made, all engine names are shown. For most use cases, you can enter a portion of the engine name. Each row in the table contains data for a particular engine. Click a column header to sort column data in ascending or descending order. Double-click on a table row to drill-down to the TIBCO BusinessWorks 5 Engine Summary display and view metrics for that particular engine. Toggle between the commonly accessed Table and Heatmap displays by clicking the drop down list on the display title.
Note: Metrics are made available by the Hawk microagent for the engine (for details, refer to documentation for TIBCO BusinessWorks Administration, Appendix A: TIBCO Hawk Microagent Methods).
|
Filter By: The display might include these filtering options: |
||||
|
|
Server: |
Select the server for which you want to show data in the display. |
||
|
|
Filter by Engine Name: |
Enter all or part of engine name to view specific engines. |
||
|
|
Active Only |
If selected, only engines with a status of ACTIVE are displayed. Otherwise, if deselected, all engines for the given Filter/Server selection are displayed. |
||
|
|
Engines |
Number of engines currently being displayed. |
||
|
|
Active |
Number of engines currently active. |
||
|
|
Stopped |
The number of stopped engines. |
||
|
Table: |
||||
|
|
Server |
The name of the Server agent. |
||
|
|
Engine Name |
The name of the engine. |
||
|
|
Alert Level |
The most critical alert state for alerts in the row:
|
||
|
|
Alert Count |
Number of current alerts |
||
|
|
Micro Agent Instance |
Unique ID of the microagent reporting the metrics. |
||
|
|
Process ID |
Process ID of engine as recognized by the server. |
||
|
|
State |
Engine status: ACTIVE, STOPPED, LIMITED, etc. (See All Servers Grid). |
||
|
|
Uptime |
Uptime in milliseconds since the engine was started. |
||
|
|
Threads |
Number of threads used by the engine. |
||
|
|
CPU % |
Percent of server CPU used by engine. |
||
|
|
Running Processes |
Number of running processes. |
||
|
|
Total Bytes |
Maximum heap memory this JVM has used. |
||
|
|
Free Bytes |
Amount of available memory from within the JVM. |
||
|
|
Used Bytes |
Total bytes of memory within the JVM currently used by the engine. Equal to value of: MaxBytes minus FreeBytes. |
||
|
|
Mem Usage KB |
Server memory, in KB, used by the engine. |
||
|
|
Mem Used % |
Percentage of allocated memory currently consumed by this engine from within the JVM. Equal to the value of: (100*UsedBytes) divided by MaxBytes. NOTE: Percent used is Long. |
||
|
|
Total Errors |
Total number of errors since the engine was started. |
||
|
|
Current Errors |
Current number of new errors. |
||
|
|
Errors/s |
The rate off errors occurring. |
||
|
|
Created/s |
The rate of processes being created. |
||
|
|
Completed/s |
The rate of processes being completed. |
||
|
|
Active/s |
The rate of processes becoming active. |
||
|
|
Aborted/s |
The rate of processes being aborted. |
||
|
|
Deployment |
The name of the deployment. |
||
|
|
Domain |
The name of the domain. |
||
|
|
Max Heap Size Bytes |
Maximum heap allocated to this engine for the JVM, in bytes. |
||
|
|
BW Version |
Engine project version number. |
||
|
|
Source |
Name of RTView Data Server sending this data (or localhost). |
||
|
|
Host |
Host name of server. |
||
|
|
Time Stamp |
The date and time of the last data update. |
||


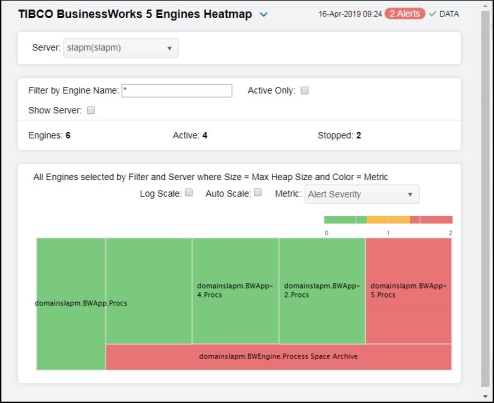
TIBCO BusinessWorks 5 Engines Heatmap
Clicking All Engines Heatmap in the left/navigation menu opens the TIBCO BW5 Engines Heatmap, which allows you to view the status and alerts of all BW5 engines. You can enter a string in the Filter by Engine Name field to show only engines in the heatmap with names that contain the string. For example, if you enter the string Madrid, all engines with Madrid in the engine name are shown in the table. If no entry is made, all engine names are shown. For most use cases, you can enter a portion of the engine name. Use the Metric drop-down menu to view the Alert Severity, Alert Count, CPU Used Percentage, Memory Used Percentage, Running Processes, or Error Count.
The heatmap is organized by host with each rectangle representing an engine. Rectangle size represents Max Heap Size and the color indicates the most critical alert state. Click on a node to drill-down to the TIBCO BusinessWorks 5 Engine Summary display and view metrics for a particular engine. Toggle between the commonly accessed Table and Heatmap displays by clicking the drop down list on the display title. Mouse-over rectangles to view more details about host performance and status.
|
Filter By: The display might include these filtering options: |
||||
|
|
Server: |
Select the server for which you want to show data in the display. |
||
|
|
Filter by Engine Name: |
Enter all or part of engine name to view specific engines. |
||
|
|
Active Only |
If selected, only engines with a status of ACTIVE are displayed. Otherwise, if deselected, all engines for the given Filter/Server selection are displayed. |
||
|
|
Show Server |
Select this check box to display the associated server names in the heatmap. |
||
|
|
Engines |
Number of engines currently being displayed. |
||
|
|
Active |
Number of engines currently active. |
||
|
|
Stopped |
The number of stopped engines. |
||
|
|
Log Scale |
Select to enable a logarithmic scale. Use Log Scale to see usage correlations for data with a wide range of values. For example, if a minority of your data is on a scale of tens, and a majority of your data is on a scale of thousands, the minority of your data is typically not visible in non-log scale graphs. Log Scale makes data on both scales visible by applying logarithmic values rather than actual values to the data. |
||
|
|
Auto Scale |
Select to enable auto-scaling. When auto-scaling is activated, the color gradient bar's maximum range displays the highest value. NOTE: Some metrics auto-scale automatically, even when Auto is not selected. |
||
|
|
Metric |
Select the metric driving the heatmap display. The default is Alert Severity. Each Metric has a color gradient bar that maps values to colors. The heatmap organizes the servers by host, where each rectangle represents an engine. Mouse-over any rectangle to display the current values of the metrics for the engine. Click on a rectangle to drill-down to the associated TIBCO BusinessWorks 5 Engine Summary display for a detailed view of metrics for that particular engine. |
||
|
|
|
Alert Severity |
The maximum level of alerts in the heatmap rectangle. Values range from 0 - 2, as indicated in the color gradient
|
|
|
|
|
Alert Count |
The total number of critical and warning alerts in the heatmap rectangle. The color gradient |
|
|
|
|
CPU Used% |
The percent (%) CPU used in the heatmap rectangle. The color gradient |
|
|
|
|
Memory Used% |
The percent (%) memory used in the heatmap rectangle. The color gradient |
|
|
|
|
Active Processes |
The number of currently active processes in the heatmap rectangle. The color gradient |
|
|
|
|
Running Processes
|
The number of currently running processes in the heatmap rectangle. The color gradient |
|
|
|
|
Created Processes |
The number of created processes in the heatmap rectangle. The color gradient |
|
|
|
|
Created/sec |
The number of created processes in the heatmap rectangle, per second. The color gradient |
|
|
|
|
Error Count |
The total number of errors in the heatmap rectangle. The color gradient |
|


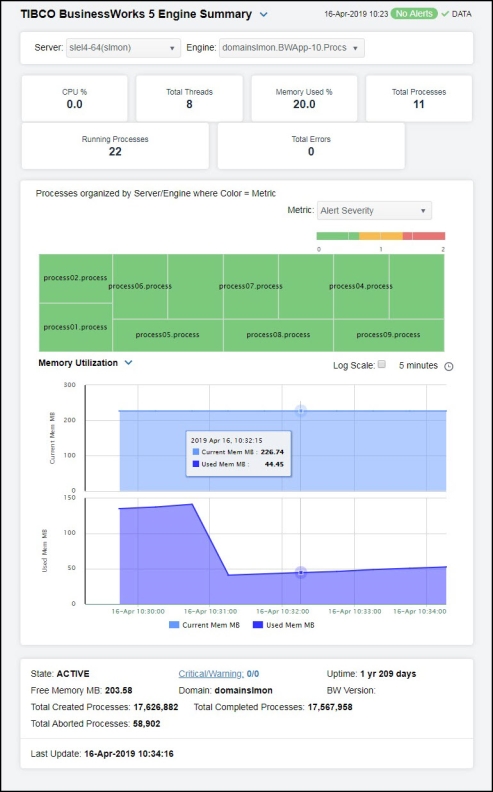
TIBCO BusinessWorks 5 Engine Summary
Clicking BW5 Engine Summary in the left/navigation menu opens the TIBCO BusinessWorks 5 Engine Summary display, which allows you to track utilization and performance metrics for specific BW5 engines and their associated processes. Clicking on the information boxes at the top of the display takes you to the TIBCO BusinessWorks 5 Engines Table display or to the TIBCO BusinessWorks 5 Processes Table display (depending on which box you select), where you can view additional data on engines and processes. In the Processes organized by Server/Engine heatmap, you can select from the available metrics to view the current status of the processes running on the selected engine. Available metrics include Alert Severity, Alert Count, Created Processes, Completed Processes, and Average Execution.
There are two options in the trend graph: System Utilization and Memory Utilization. In the System Utilization option on the trend graph, you can view trend data for running processes and CPU percentage over a selected time range. In the Memory Utilization option on the trend graph, you can view trend data for used memory (in megabytes) and current memory (in megabytes) over a selected time range.
Clicking the Critical/Warning link at the bottom of the display opens the Alerts Table by Component display.
|
Filter By: The display might include these filtering options: |
||||
|
|
Server: |
Select the server for which you want to view data in the display. |
||
|
|
Engine: |
Select the engine for which you want to view data in the display |
||
|
Fields and Data |
||||
|
|
CPU % |
The percentage of CPU utilization on the engine. |
||
|
|
Total Threads |
The total number of threads being executed on the engine. |
||
|
|
Memory Used % |
The percentage of memory utilization on the engine. |
||
|
|
Total Processes |
The total number of deployed processes on the engine. |
||
|
|
Running Processes |
The total number of running processes on the engine. |
||
|
|
Total Errors |
The total number of errors generated on the engine. |
||
|
Heatmap |
Shows processes organized by Server/Engine where Size = Creation Count and Color = Average Execution. Click on a node to drill down to a specific engine. |
|||
|
|
Metric |
Select the metric driving the heatmap display. The default is Alert Severity. Each Metric has a color gradient bar that maps values to colors. The heatmap organizes the servers by host, where each rectangle represents an engine. Mouse-over any rectangle to display the current values of the metrics for the engine. Click on a rectangle to drill-down to the associated TIBCO BusinessWorks 5 Process Summary display for a detailed view of metrics for that particular engine. |
||
|
|
|
Alert Severity |
The maximum level of alerts in the heatmap rectangle. Values range from 0 - 2, as indicated in the color gradient
|
|
|
|
|
Alert Count |
The total number of critical and warning alerts in the heatmap rectangle. The color gradient |
|
|
|
|
Created Processes |
The number of created processes in the heatmap rectangle. The color gradient |
|
|
|
|
Completed Processes |
The number of completed processes in the heatmap rectangle. The color gradient |
|
|
|
|
Avg Execution |
The average exection time for processes in the heatmap rectangle. The color gradient |
|
|
|
Trend Graphs |
System Utilization CPU % -- Traces the CPU utilization for the engine. Running Processes -- Traces the number of running processes on the engine. Memory Utilization Current Mem MB -- Traces the current memory available for the engine. Used Mem MB -- Traces the used memory on the engine. |
||
|
|
|
Log Scale |
Select to enable a logarithmic scale. Use Log Scale to see usage correlations for data with a wide range of values. For example, if a minority of your data is on a scale of tens, and a majority of your data is on a scale of thousands, the minority of your data is typically not visible in non-log scale graphs. Log Scale makes data on both scales visible by applying logarithmic values rather than actual values to the data. |
|
|
|
|
Time Settings |
Select a time range from the drop down menu varying from 5 Minutes to Last 7 Days. By default, the time range end point is the current time.
To change the time range, deselect the now toggle, which displays some additional date fields. You can click the left and right arrow buttons to decrease the end time by one time period (the time selected in the Time range drop down) per click, or you can choose the date and time from the associated calendar and clock icons. You can also enter the date and time in the text field using the following format: MMM dd, YYYY HH:MM:ss. For example, Aug 21, 2018 12:24 PM. Click the now toggle to reset the time range end point to the current time.
|
|
|
State |
ACTIVE -- The BW microagent is providing live data and the engine is assumed active. SUSPENDED -- This state is reported by the BW microagent. STANDBY -- This state is reported by the BW microagent. STOPPING -- This state is reported by the BW microagent. STOPPED -- This state is reported by the BW microagent. LIMITED -- Live data has been received from TIBCO, but deployment data from the custom RTView MicroAgent has not been received. EXPIRED -- The associated server for the engine is currently in an EXPIRED state and is unavailable or stopped sending data. |
|||
|
Free Memory MB |
The amount of free memory, in megabytes. |
|||
|
Total Created Processes |
A BW Engine runs processes by creating instances of process definitions and making them active. A given process instance has a lifetime during which it may be suspended, swapped, queued, etc. until it is either completed or aborted. The Total value is calculated using the Hawk method named GetProcessDefinitions that returns statistics about the instances of each process definition including cumulative counts of completed, aborted, suspended, etc. |
|||
|
Total Aborted Processes |
||||
|
Critical/Warning |
The number of critical and warning alerts. |
|||
|
Domain |
The name of the domain. |
|||
|
Total Completed Processes |
The total number of completed processes. |
|||
|
Uptime |
Days, hours, and minutes since the engine was started. |
|||
|
BW Version |
|
|||
|
Last Update |
The date and time of the last data update. |
|||