EMS Durables
These displays present performance metrics and alert status for all durables or one durable on an EMS Server. Clicking EMS Durables from the left/navigation menu opens the TIBCO EMS Durables display, which shows all available utilization metrics for all EMS durables on a specific EMS server. The option available under EMS Durables is:
| • | Durable Summary: Opens the TIBCO EMS Durable display, which shows metrics and trend data for a particular durable on a particular EMS Server. |
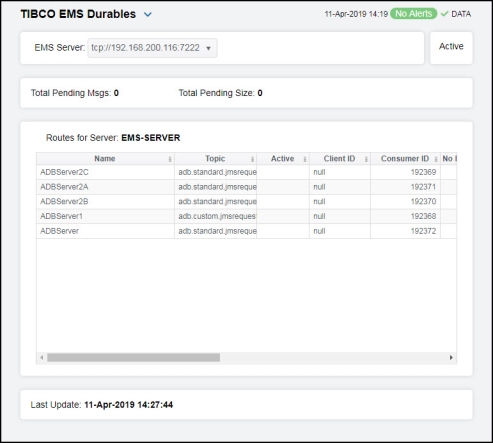
TIBCO EMS Durables
Clicking EMS Durables from the left/navigation menu opens the TIBCO EMS Durables display, which shows utilization metrics for all durables on a particular EMS Server. Double-clicking a row in the table opens the selected durable in the TIBCO EMS Durable display.
|
Filter |
|||
|
|
EMS Server |
The EMS Server selected from this drop-down menu populates all associated Durables data in this display. The field to the right of the EMS Server drop down displays the status of the server. |
|
|
Fields and Data This display includes: |
|||
|
|
Total Pending Msgs |
The total number of pending messages for the durable. |
|
|
|
Total Pending Size |
The total amount of pending messages, in bytes, for the selected durable. |
|
|
|
Durables for Server Table |
This table shows metrics for each durable on the selected server. |
|
|
|
|
Name |
The name of the durable. |
|
|
|
Topic |
The name of the topic. |
|
|
Active |
Indicates whether the durable is active. |
|
|
|
Client ID |
A unique string identifier assigned to each client. |
|
|
|
|
Consumer ID |
A unique string identifier assigned to each consumer. |
|
|
No Local Enabled |
Indicates whether the subscriber receives messages from all connections or its local connection. True -- The subscriber does not receive messages sent from its local connection. False -- The subscriber receives messages from all connections. |
|
|
|
Pending Msgs |
The total number of pending messages for the selected durable. |
|
|
|
|
Pending Msg Size |
The total amount of pending messages, in bytes, for the selected durable. |
|
|
Selector |
Indicates that the subscriber only receives messages that match this selector. |
|
|
|
User Name |
The name of the user of this durable subscriber. |
|
|
|
|
Time Stamp |
The date and time this row of data was last updated. |
|
|
Last Data Update |
The date and time of the last data update. |
|
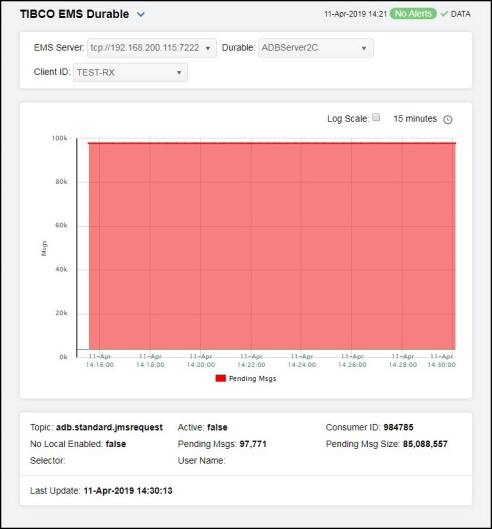
TIBCO EMS Durable
Clicking Durable Summary from the left/navigation menu opens the TIBCO EMS Durable display, which shows metrics and trend data for a particular durable on a particular EMS Server. Hovering over the trend graphs displays data for each of the metrics at a specific time.
|
Filter |
|||
|
|
EMS Server |
The EMS Server selected from this drop-down menu populates all associated Durables data in this display. The field to the right of the EMS Server drop down displays the status of the server. |
|
|
|
Durable |
Select the durable for which you want to view data. |
|
|
|
Client ID |
Select the client ID for which you want to view data. |
|
|
Fields and Data This display includes: |
|||
|
|
Total Pending Msgs |
The total number of pending messages for the durable. |
|
|
|
Total Pending Size |
The total amount of pending messages, in bytes, for the selected durable. |
|
|
|
Trend Graph |
Shows message data for the selected consumer. Pending Msgs -- Traces the number of pending messages for the durable. |
|
|
|
|
Log Scale |
This option should be used when the range of your data is very broad. When checked, the values are displayed using a logarithmic scale rather than using the actual values so that data on the extreme ends of the scale can be viewed more effectively. For example, if you have data that ranges from the tens to the thousands, the data in the range of the tens will be neglected visually if you do not check this option.
|
|
|
|
Time Settings |
Select a time range from the drop down menu varying from 5 Minutes to Last 7 Days. By default, the time range end point is the current time.
To change the time range, deselect the now toggle, which displays some additional date fields. You can click the left and right arrow buttons to decrease the end time by one time period (the time selected in the Time range drop down) per click, or you can choose the date and time from the associated calendar and clock icons. You can also enter the date and time in the text field using the following format: MMM dd, YYYY HH:MM:ss. For example, Aug 21, 2018 12:24 PM. Click the now toggle to reset the time range end point to the current time.
|
|
|
Topic |
The name of the topic. |
|
|
|
No Local Enabled |
Indicates whether the subscriber receives messages from all connections or its local connection. True -- The subscriber does not receive messages sent from its local connection. False -- The subscriber receives messages from all connections. |
|
|
|
Selector |
Indicates that the subscriber only receives messages that match this selector. |
|
|
|
Active |
Indicates whether the durable is active. |
|
|
|
Pending Msgs |
The total number of pending messages for the selected durable. |
|
|
|
User Name |
The name of the user of this durable subscriber. |
|
|
|
Consumer ID |
A unique string identifier assigned to each consumer. |
|
|
|
Pending Msg Size |
The total amount of pending messages, in bytes, for the selected durable. |
|
|
|
Last Update |
The date and time of the last data update. |
|