EMS Routes
These displays present performance metrics and alert status for all routes or one route on an EMS Server. Clicking EMS Routes from the left/navigation menu opens the TIBCO EMS Routes display, which shows all available utilization metrics for all EMS routes on a specific EMS server. The option available under EMS Routes is:
| • | Route Summary: Opens the TIBCO EMS Route display, which shows metrics and trend data for a particular route on a particular EMS Server. |
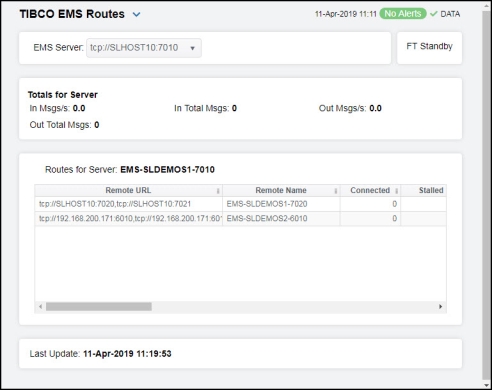
TIBCO EMS Routes
Clicking EMS Routes from the left/navigation menu opens the TIBCO EMS Routes display, which shows all available utilization metrics for all routes on a specific EMS server. Double-clicking on a route in the Routes for Server table opens the TIBCO EMS Route display, which shows additional details for the selected route. Inbound metrics, such as In Msgs/s, indicate an in route to the server. Outbound metrics, such as Out Msgs/s, indicate an out route to the server.
|
Filter |
|||
|
|
EMS Server |
The EMS Server selected from this drop-down menu populates all associated Routes data in this display. |
|
|
Fields and Data This display includes: |
|||
|
|
Status |
The current status of the server. |
|
|
|
Totals For Server |
Shows metrics for all server routes on the selected server. |
|
|
|
|
In Msgs / sec |
The number of inbound messages, per second. |
|
|
|
In Total Msgs |
The total number of inbound messages. |
|
|
|
Out Msgs / sec |
The number of outbound messages, per second. |
|
|
|
Out Total Msgs |
The total number of outbound messages. |
|
|
Table |
This table shows metrics for each server route on the selected server. Select a route to view details. |
|
|
|
|
Remote URL |
The URL of the remote server. |
|
|
Remote Name |
The name of the remote server. |
|
|
|
Connected |
When checked, the server route is connected. |
|
|
|
|
Stalled |
Indicates whether the IO flow stalled on the route. A value of 0 (zero) = not stalled. A value of 1 = stalled. |
|
|
In Bytes/s |
The rate of inbound data in bytes, per second. |
|
|
|
In Msgs/s |
The rate of inbound messages in number of messages per second. |
|
|
|
|
In Total Bytes |
The total number of inbound bytes. |
|
|
In Total Msgs |
The total number of inbound messages. |
|
|
|
Out Bytes/s |
The rate of outbound data in bytes per second. |
|
|
|
|
Out Msgs/s |
The rate of outbound messages in number of messages per second. |
|
|
Out Total Bytes |
The total number of outbound bytes. |
|
|
|
Out Total Msgs |
The total number of outbound messages. |
|
|
|
|
Zone Name |
The name of the zone for the route. |
|
|
Zone Type |
Indicates a multi-hop or one-hop zone. |
|
|
|
Active |
Indicates whether the server route is currently transferring data: 1 = true 0 = false |
|
|
|
|
Inactive |
Indicates whether the server route is currently transferring data: 1 = true 0 = false |
|
|
Suspended |
Indicates whether outbound messages to the route have been suspended: 1 = true 0 = false |
|
|
|
remoteURLNoCommas |
The IP address and name for the remote connection. |
|
|
|
|
Time Stamp |
The date and time of the last data update. |
|
|
Last Update |
The date and time of the last data update. |
|
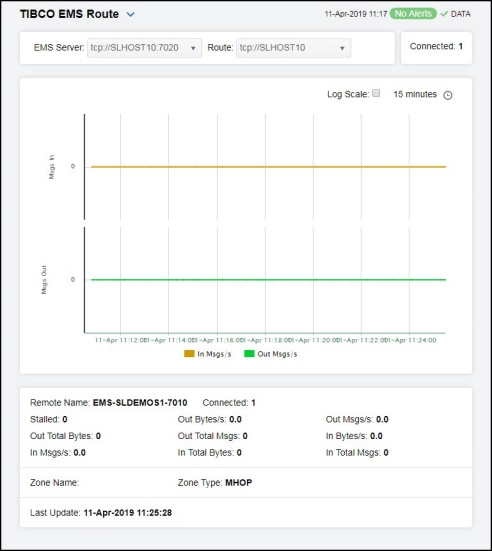
TIBCO EMS Route
Clicking Route Summary from the left/navigation menu opens the TIBCO EMS Route display, which shows metrics and trend data for a particular route on a particular EMS Server. Hovering over the trend graphs displays data for each of the metrics at a specific time.
|
Filter |
|||
|
|
EMS Server |
The EMS Server selected from this drop-down menu populates all associated Routes data in this display. |
|
|
|
Route |
Select the route for which you want to view data in the display. |
|
|
Fields and Data This display includes: |
|||
|
|
Connected |
The number of routes connected. |
|
|
|
Trend Graphs |
Shows message data for the selected route. In Msgs/s -- Traces the number of inbound messages, per second. Out Msgs/s -- Traces the number of outbound messages, per second. |
|
|
|
|
Log Scale |
This option should be used when the range of your data is very broad. When checked, the values are displayed using a logarithmic scale rather than using the actual values so that data on the extreme ends of the scale can be viewed more effectively. For example, if you have data that ranges from the tens to the thousands, the data in the range of the tens will be neglected visually if you do not check this option.
|
|
|
|
Time Settings |
Select a time range from the drop down menu varying from 5 Minutes to Last 7 Days. By default, the time range end point is the current time.
To change the time range, deselect the now toggle, which displays some additional date fields. You can click the left and right arrow buttons to decrease the end time by one time period (the time selected in the Time range drop down) per click, or you can choose the date and time from the associated calendar and clock icons. You can also enter the date and time in the text field using the following format: MMM dd, YYYY HH:MM:ss. For example, Aug 21, 2018 12:24 PM. Click the now toggle to reset the time range end point to the current time.
|
|
|
Remote Name |
The name of the remote server. |
|
|
|
Stalled |
Indicates whether the IO flow stalled on the route. A value of 0 (zero) = not stalled. A value of 1 = stalled. |
|
|
|
Out Total Bytes |
The total number of outbound bytes. |
|
|
|
In Msgs/s |
The rate of inbound messages in number of messages per second. |
|
|
|
Connected |
The number of routes connected. |
|
|
|
Out Bytes/s |
The rate of outbound data in bytes per second. |
|
|
|
Out Total Msgs |
The total number of outbound messages. |
|
|
|
In Total Bytes |
The total number of inbound bytes. |
|
|
|
Out Msgs/s |
The rate of outbound messages in number of messages per second. |
|
|
|
In Bytes/s |
The rate of inbound data in bytes, per second. |
|
|
|
In Total Msgs |
The total number of inbound messages. |
|
|
|
Zone Name |
The name of the zone for the route. |
|
|
|
Zone Type |
Indicates a multi-hop or one-hop zone. |
|
|
|
Last Update |
The date and time of the last data update. |
|