EMS Servers
These displays present performance metrics and alert status for all EMS servers. Clicking EMS Servers from the left/navigation menu opens the TIBCO EMS Servers Table display, which shows all available utilization metrics for all EMS servers. The options available under EMS Servers are:
| • | All Servers Heatmap: Opens the TIBCO EMS Servers Heatmap , which shows server and alert status for all EMS servers. |
| • | Single Server Summary: Opens the TIBCO EMS Server Summary display, which shows information for a single EMS server such as server connection details, the number of client connections, memory utilization, message performance metrics and alert status. |
| • | Single Server Trends: Opens the TIBCO EMS Server Trends display, which shows utilization metrics for a single EMS server, such as the number of client connections, number of pending messages and in/out rate, and memory and disk utilization. |
| • | Destinations: Opens the TIBCO EMS Server Destinations display, which shows destination data for a selected server. |
| • | Connections: Opens the TIBCO EMS Server Connections display, which shows connection information for a selected server. |
| • | Other Server Metrics: Opens the TIBCO EMS Bridges, Users, Ports display, which shows bridges data, along with associated users and ports, for a selected server. |
TIBCO EMS Servers Table
Investigate detailed utilization metrics for all EMS servers. The TIBCO EMS Servers Table contains all metrics available for servers, including the number of current client connections. Each row in the table contains data for a particular server. Click a column header to sort column data in ascending or descending order. Double-click on a table row to drill-down to the TIBCO EMS Server Summary display and view metrics for that particular server. Toggle between the commonly accessed Table and Heatmap displays by clicking the drop down list on the display title.
|
Fields and Data This display includes: |
|||
|
|
Servers |
The total number of active, inactive and standby EMS servers. Inactive Servers are represented in dark red. Standby Servers are represented in blue. |
|
|
|
Active |
The total number of currently active EMS servers. |
|
|
|
Max In Msgs/s |
The highest rate of inbound messages, per second, from all producers and consumers on all EMS servers. |
|
|
|
Max Out Msgs/s |
The highest rate of outbound messages, per second, from all producers and consumers on all EMS servers. |
|
|
|
Total Pending Msgs |
The total number of inbound and outbound messages waiting to be processed on all EMS servers. |
|
|
|
Active Only |
Select this check box to display only the active servers in the table below. |
|
|
|
Table |
This table shows information for all EMS servers. Click on a table row to drill-down to the TIBCO EMS Server Summary display and view metrics for that particular server. |
|
|
|
|
URL |
Select to include servers that are currently in Standby mode. Standby Servers are represented in blue. |
|
|
|
Server Name |
The name of the server. |
|
|
|
Host |
The name or IP address for the host server. |
|
|
|
Alert Level |
The current alert level.
|
|
|
|
Alert Count |
The number of current alerts. |
|
|
|
State |
The server status: Active -- The server is currently processing requests. Inactive -- The server is not currently processing requests. Inactive Servers are represented in dark red. Standby -- The server is functioning as a backup for a primary server. Standby Servers are represented in blue. |
|
|
|
Pending Msgs |
The number of currently pending messages on the server. |
|
|
|
Connections |
The number of clients currently connected to the server. |
|
|
|
Disk Reads/s |
The speed at which the server reads disk data. |
|
|
|
Disk Writes/s |
The speed at which the server writes data to disk. |
|
|
|
Durables |
The number of durables on the server. |
|
|
|
Msgs In |
The number of inbound messages received by the server since the server was started. |
|
|
|
In Msgs/s |
The rate of inbound messages in number of messages per second. |
|
|
|
Max Msg Memory Bytes |
The maximum amount of memory, in bytes, allocated for use by messages on the server. |
|
|
|
Msg Memory Bytes |
The amount of memory, in bytes, currently used by messages on the server. |
|
|
|
Msg Memory % |
The amount of memory, in percent, used by messages on the server. |
|
|
|
Msg Mem Pooled |
The currently allocated pool size, in bytes, for messages. |
|
|
|
Out Msgs |
The number of outbound messages sent by the server since the server was started. |
|
|
|
Out Msgs/s |
The rate of outbound messages in number of messages per second. |
|
|
|
Pending Msg Size |
The amount of space, in bytes, pending messages use on the server. |
|
|
|
Version |
The TIBCO EMS software version currently running. |
|
|
|
FT URL |
The IP address and port number for the source (application, server, and so forth) associated with the alert. |
|
|
|
Async DB Size Bytes |
The amount of database space, in bytes, occupied by asynchronous data on the server. |
|
|
|
Backup Name |
The name of the backup server assigned as the backup to this server. |
|
|
|
PID |
The process ID of the EMS server. |
|
|
|
Queues |
The number of message queues. |
|
|
|
Start Time |
The date and time that the server was started. |
|
|
|
Sync DB Size Bytes |
The amount of database space, in bytes, occupied by synchronous data on the server. |
|
|
|
Topics |
The number of currently active topics on the server. |
|
|
|
Uptime |
The amount of time, in milliseconds, since the server was started. |
|
|
|
Expired |
When checked, performance data has not been received within the time specified (in seconds) in the Expire Time field in the Duration region in the RTView Configuration Application > (Project Name) > Solution Package Configuration > TIBCO Enterprise Message Service > DATA STORAGE tab. The Delete Time field (also in the Duration region) allows you to define the amount of time (in seconds) in which the row will be removed from the table if there is no response. |
|
|
|
Time Stamp |
The date and time this row of data was last updated. |


TIBCO EMS Servers Heatmap
Clicking All Servers Heatmap in the left/navigation menu opens the TIBCO EMS Servers Heatmap, which allows you to view the status and alerts of all EMS servers. Use the Metric drop-down menu to view the Alert Severity, Alert Count, Connections, Pending Messages, Inbound Message Rate, Outbound Message Rate, or Message Memory Percent (%).
The heatmap is organized by host, each rectangle representing a server. The rectangle color indicates the most critical alert state. Click on a node to drill-down to the TIBCO EMS Server Summary display and view metrics for a particular server. Toggle between the commonly accessed Table and Heatmap displays by clicking the drop down list on the display title. Mouse-over rectangles to view more details about host performance and status.
|
Fields and Data This display includes: |
|||
|
|
Servers |
The total number of active, inactive, and standby EMS servers. |
|
|
|
Active |
The total number of currently active EMS servers. |
|
|
|
In Total Msgs/s |
The total number of inbound messages, per second, from all producers and consumers on all EMS servers. |
|
|
|
Out Total Msgs/s |
The total number of outbound messages, per second, from all producers and consumers on all EMS servers. |
|
|
|
Pending Msgs |
The total number of pending messages waiting to be processed on all EMS servers. Click to open the TIBCO EMS Servers Table display. |
|
|
|
Show Host |
Select this check box to display the name of the host for the servers in the heatmap. |
|
|
|
Log Scale |
This option enables visualization on a logarithmic scale, and should be used when the range in your data is very broad. For example, if you have data that ranges from the tens to the thousands, then data in the range of tens will be neglected visually if you do not check this option. This option makes data on both extreme ranges visible by using the logarithmic of the values rather than the actual values.
|
|
|
|
Auto Scale |
When checked, the values of the selected metric are auto-scaled to its highest defined value. When unchecked, the values of the selected metric display based on the threshold defined for the alert associated with the selected metric. Selecting Auto helps to visualize the range of the values currently present for the selected metric instead of the threshold of the alert that has been associated with the metric. All metrics that have not been associated in the heatmap defaults with alerts use a monochromatic color gradient bar (whites and greens). All metrics that have been associated in the heatmap defaults with alerts use a multi-chromatic color gradient bar (reds, yellows, white, and greens). |
|
|
|
Metric |
Select the metric driving the heatmap display. The default is Alert Severity. Each Metric has a color gradient bar that maps values to colors. The heatmap organizes the servers by host, where each rectangle represents a server. Mouse-over any rectangle to display the current values of the metrics for the Server. Click on a rectangle to drill-down to the associated TIBCO EMS Server Summary display for a detailed view of metrics for that particular server. |
|
|
|
|
Alert Severity |
The maximum alert level in the item (index) associated with the rectangle. Values range from 0 to 2, as indicated in the color gradient bar 2 -- Metrics that have exceeded their specified ALARMLEVEL threshold and have an Alert Severity value of 2 are shown in red. For a given rectangle, this indicates that one or more metrics have exceeded their alarm threshold. 1 -- Metrics that have exceeded their specified WARNINGLEVEL threshold and have an Alert Severity value of 1 are shown in yellow. For a given rectangle, this indicates that one or more metrics have exceeded their warning threshold. 0 -- Metrics that have not exceeded either specified threshold have an Alert Severity value of 0 and are shown in green. For a given rectangle, this indicates that no metrics have exceeded a specified alert threshold.
|
|
|
|
Alert Count |
The total number of alarm and warning alerts in a given item (index) associated with the rectangle. The color gradient bar |
|
|
|
Connections |
The total number of connections in a given item (index) associated with the rectangle. The color gradient bar The Auto option does not impact this metric. |
|
|
|
Pending Msgs |
The total number of pending messages in a given item (index) associated with the rectangle. The color gradient bar When Auto is checked, the numeric values in the color gradient bar show the range of the data being displayed rather than the default values. The middle value changes accordingly to indicate the color of the middle value of the range. |
|
|
|
In Msgs/s |
The total number of inbound messages in a given item (index) associated with the rectangle. The color gradient bar When Auto is checked, the numeric values in the color gradient bar show the range of the data being displayed rather than the default values. The middle value changes accordingly to indicate the color of the middle value of the range. |
|
|
|
Out Msgs/s |
The total number of outbound messages in a given item (index) associated with the rectangle. The color gradient bar When Auto is checked, the numeric values in the color gradient bar show the range of the data being displayed rather than the default values. The middle value changes accordingly to indicate the color of the middle value of the range. |
|
|
|
Msg Mem % |
The percent (%) memory used by messages in a given item (index) associated with the rectangle. The color gradient bar When Auto is checked, the numeric values in the color gradient bar show the range of the data being displayed rather than the default values. The middle value changes accordingly to indicate the color of the middle value of the range.
|
 , where
  shows the range of the value/color mapping. The numerical values in the gradient bar range from
  shows the range of the value/color mapping. The numerical values in the gradient bar range from
  shows the range of the value/color mapping. By default, the numerical values in the gradient bar range from
  shows the range of the value/color mapping. By default, the numerical values in the gradient bar range from
  shows the range of the value/color mapping. By default, the numerical values in the gradient bar range from
  shows the range of the value/color mapping. By default, the numerical values in the gradient bar range from
TIBCO EMS Server Summary
Clicking Single Server Summary in the left/navigation menu opens the TIBCO EMS Server Summary display, which allows you to track utilization and performance metrics for specific servers. Clicking on the message/connection information boxes at the top of the display takes you to the TIBCO EMS Server Destinations display, where you can view additional destination data. In the trend graph region, you can select from Message Rates, which traces inbound/outbound messages per second, or Message Flows, which traces total inbound/outbound messages in bytes. Clicking the Critical/Warning link at the bottom of the display opens the Alerts Table by Component display. Clicking the Topics link at the bottom of the display opens the TIBCO EMS Topics Table display. Clicking the Queues link at the bottom of the display opens the TIBCO EMS Queues Table display.
|
Fields and Data This display includes: |
|||
|
|
EMS Server |
Select the EMS Server for which you want to view data. The selection made here populates this display. |
|
|
|
Pending Messages |
The total number of pending messages on the server. |
|
|
|
In Msgs/s |
The rate of inbound messages on the server. |
|
|
|
Out Msgs/s |
The rate of outbound messages on the server. |
|
|
|
Connections |
The number of connections on the server. |
|
|
|
Inbound/ Outbound KB/s |
The rate of inbound and outbound kilobytes on the server. |
|
|
|
Message Memory % |
The percentage of message memory utilization on the server. |
|
|
|
Trend Graphs |
Message Rates Trend Graph In Msgs / sec -- Traces the number of inbound messages, per second, from all producers and consumers. Out Msgs / sec -- Traces the number of outbound messages, per second, from all producers and consumers. Pending Msgs -- Traces the total number of inbound and outbound messages currently waiting to be processed. Message Flows Trend Graph In Msgs -- Traces the total number of inbound messages from all producers and consumers. Out Msgs -- Traces the number of outbound messages from all producers and consumers. Pending Msgs -- Traces the total number of inbound and outbound messages currently waiting to be processed. |
|
|
|
|
Log Scale |
This option should be used when the range of your data is very broad. When checked, the values are displayed using a logarithmic scale rather than using the actual values so that data on the extreme ends of the scale can be viewed more effectively. For example, if you have data that ranges from the tens to the thousands, the data in the range of the tens will be neglected visually if you do not check this option.
|
|
|
|
Time Settings |
Select a time range from the drop down menu varying from 5 Minutes to Last 7 Days. By default, the time range end point is the current time.
To change the time range, deselect the now toggle, which displays some additional date fields. You can click the left and right arrow buttons to decrease the end time by one time period (the time selected in the Time range drop down) per click, or you can choose the date and time from the associated calendar and clock icons. You can also enter the date and time in the text field using the following format: MMM dd, YYYY HH:MM:ss. For example, Aug 21, 2018 12:24 PM. Click the now toggle to reset the time range end point to the current time.
|
|
|
Server Information |
State |
The server status: Active -- The server is currently processing requests. Inactive -- The server is not currently processing requests. Standby -- The server is functioning as a backup for a primary server. |
|
|
|
Critical/Warning |
Lists the number of critical and warning level alerts on the server. |
|
|
|
Backup |
The name of the backup server for the server. |
|
|
|
Server Name |
The name of the selected server. |
|
|
|
FT URL |
The IP address and port number, or the hostname and port number, of the fault tolerant standby server assigned to this server. |
|
|
|
Topics |
The number of topics currently active on the server. Click to open the TIBCO EMS Topics Table display for details. |
|
|
|
Queues |
The number of queues currently active on the server. Click to open the TIBCO EMS Queues Table display for details. |
|
|
|
Durables |
The number of durables currently active on the server. |
|
|
|
Producers |
The number of producers currently active on the server. |
|
|
|
Consumers |
The number of consumers currently connected to the server. |
|
|
|
Routes |
The number of routes defined on the server. |
|
|
|
Sync DB Size MB |
The amount of database space, in megabytes, used by synchronous message persistence data on the server. |
|
|
|
Start Time |
The data and time that the server was started. |
|
|
|
Uptime |
The amount of time since the server was started. Format: dd HH:MM:SS <days> <hours>:<minutes>:<seconds> For example: 10d 08:41:38 |
|
|
|
Async DB Size MB |
The amount of database space, in megabytes, used by asynchronous message persistence data on the server |
|
|
|
Version |
The TIBCO EMS software version currently running. |
|
|
|
Message Memory MB |
The amount of memory, in megabytes, used by message persistence on the server. |
|
|
|
Max Message Memory MB |
The maximum amount of memory, in megabytes, used by message persistence on the server.
|
|
|
|
Pending Message Size MB |
The total size of inbound and outbound messages, in megabytes, currently waiting to be processed. |
|
|
|
Last Update |
The time that a data update was last made. |
TIBCO EMS Server Trends
Clicking Single Server Trends in the left/navigation menu opens the TIBCO EMS Server Trends display, which allows you to view trend graphs in parallel to investigate performance issues for a specific server. Clicking on the message/connection information boxes at the top of the display takes you to the TIBCO EMS Servers Table display, where you can view additional data for all of the servers. Hovering over the trend graphs displays data for each of the metrics at a specific time.
|
Fields and Data This display includes: |
|||
|
|
EMS Server |
Select the EMS server for which you want to view data from this drop-down menu. The selection made here populates this display. |
|
|
|
Connections |
The total number of client connections. |
|
|
|
In Msgs/s /Out Msgs/s |
The number of inbound messages, per second, from all producers and consumers and the number of outbound messages, per second, from all producers and consumers. |
|
|
|
Pending Msgs |
The total number of messages currently waiting to be processed. |
|
|
|
Msg Memory % |
The amount of memory, in percent, used by messages. |
|
|
|
Async DB Size MB |
The amount of database space, in megabytes, used by asynchronous data on the server. |
|
|
|
Disk Reads/s / Writes/s |
The amount of disk data, in kilobytes, read by the server since the server was started and the amount of data, in kilobytes, written to disk by the server since the server was started. |
|
|
|
Server Activity Trends |
Shows metrics for the selected server. Connections -- Traces the total number of client connections. Msgs In/Sec -- Traces the number of inbound messages, per second, from all producers and consumers. Msgs Out/Sec -- Traces the number of outbound messages, per second, from all producers and consumers. Pending Msgs -- Traces the total number of messages currently waiting to be processed. Msg Memory % -- Traces the amount of memory, in percent, used by messages. Async Store MB -- Traces the amount of database space, in megabytes, used by asynchronous data on the server. Disk Read KB -- Traces the amount of disk data, in kilobytes, read by the server since the server was started. Disk Write KB -- Traces the amount of data, in kilobytes, written to disk by the server since the server was started. |
|
|
|
|
Log Scale |
This option should be used when the range of your data is very broad. When checked, the values are displayed using a logarithmic scale rather than using the actual values so that data on the extreme ends of the scale can be viewed more effectively. For example, if you have data that ranges from the tens to the thousands, the data in the range of the tens will be neglected visually if you do not check this option.
|
|
|
|
Time Settings |
Select a time range from the drop down menu varying from 5 Minutes to Last 7 Days. By default, the time range end point is the current time.
To change the time range, deselect the now toggle, which displays some additional date fields. You can click the left and right arrow buttons to decrease the end time by one time period (the time selected in the Time range drop down) per click, or you can choose the date and time from the associated calendar and clock icons. You can also enter the date and time in the text field using the following format: MMM dd, YYYY HH:MM:ss. For example, Aug 21, 2018 12:24 PM. Click the now toggle to reset the time range end point to the current time.
|
|
|
Server Name |
The name of the EMS Server selected from the EMS Server drop-down menu. |
|
|
|
Critical/Warning |
The total number of critical and warning alerts for the server. |
|
|
|
Last Update |
The date and time of the last data update. |
|

TIBCO EMS Server Destinations
Clicking Destinations in the left/navigation menu opens the TIBCO EMS Server Destinations display, which allows you to view queue and topic information related to a particular EMS server.
|
Fields and Data This display includes: |
|||
|
|
EMS Server |
Select the EMS server for which you want to view data from this drop-down menu. The selection made here populates this display. |
|
|
|
Pending Messages |
The total number of messages currently waiting to be processed. |
|
|
|
In Msgs/s |
The number of inbound messages, per second, from all producers and consumers. |
|
|
|
Out Msgs/s |
The number of outbound messages, per second, from all producers and consumers. |
|
|
|
Connections |
The total number of client connections. |
|
|
|
In/Out KB/s |
The rate of incoming kilobytes (per second) and the rate of outgoing kilobytes (per second). |
|
|
|
Message Memory % |
The amount of memory, in percent, used by messages. |
|
|
|
Queues Table |
Queue Name |
The name of the queue. |
|
|
|
In Msgs/s |
The number of inbound messages for the queue, per second. This metric comes directly from the tibjms.admin.DestinationInfo class from TIBCO. |
|
|
|
In Total Msgs |
The total number of inbound messages for the queue. |
|
|
|
Out Msgs/s |
The number of outbound messages for the queue, per second. This metric comes directly from the tibjms.admin.DestinationInfo class from TIBCO. |
|
|
|
Out Total Msgs |
The total number of outbound messages for the queue. |
|
|
|
Pending Msgs |
The number of currently pending messages for the queue. |
|
|
|
Pending Msg Size |
The amount of space, in bytes, used by pending messages for the queue. |
|
|
|
Consumers |
The number of active and inactive consumers. |
|
|
|
Fail Safe |
When checked, the message is marked as failsafe delivery. |
|
|
|
Flow Control Max Bytes |
The maximum number of bytes allocated for use by flow control. |
|
|
|
Global |
When checked, the message is global and is routed to other servers. |
|
|
|
In KB/s |
The amount of inbound messages for the queue, in kilobytes per second. |
|
|
|
In KB |
The total amount of inbound messages for the queue, in kilobytes. |
|
|
|
Max Bytes |
The maximum amount of bytes allocated for use by the queue. |
|
|
|
Max Msgs |
The maximum number of messages allocated for use by the queue. |
|
|
|
Overflow Policy |
Indicates whether an overflow policy is set for the queue: 0 = No policy is set. 1 = A policy is set. |
|
|
|
Secure |
When checked, the queue is designated as secure and enforces permission policies. |
|
|
|
Static |
When checked, the queue has a static destination. |
|
|
|
Description |
Descriptive text to help the administrator identify this resource. |
|
|
|
Expired |
When checked, performance data has not been received within the time specified (in seconds) in the Expire Time field in the Duration region in the RTView Configuration Application > (Project Name) > Solution Package Configuration > TIBCO Enterprise Message Service > DATA STORAGE tab. The Delete Time field (also in the Duration region) allows you to define the amount of time (in seconds) in which the row will be removed from the table if there is no response. |
|
|
|
Time Stamp |
The date and time this row of data was last updated. |
|
|
|
Out KB/s |
The amount of outbound messages for the queue, in kilobytes per second. |
|
|
|
Out KB |
The total amount of outbound messages for the queue, in kilobytes. |
|
|
|
Exclusive |
When checked, the server sends all messages on this queue to one consumer. |
|
|
|
Max Redelivery |
The maximum number of attempts for attempting redelivery of a message. |
|
|
|
Filter In Patterns |
The string used to filter the data in the row. |
|
|
|
Receivers |
The number of receivers that receive queue message. |
|
|
Topics Table |
Topic Name |
The name of the topic. |
|
|
|
In Msgs/s |
The number of inbound messages for the topic, per second. Note: This metric comes directly from the tibjms.admin.DestinationInfo class from TIBCO. |
|
|
|
In Total Msgs |
The total number of inbound messages for the topic. |
|
|
|
Out Msgs/s |
The number of outbound messages for the topic, per second. Note: This metric comes directly from the tibjms.admin.DestinationInfo class from TIBCO. |
|
|
|
Out Total Msgs |
The total number of outbound messages for the topic. |
|
|
|
Pending Msgs |
The number of currently pending messages for the topic. |
|
|
|
Pending Msg Size |
The amount of space, in bytes, used by pending messages for the topic. |
|
|
|
Active Durables |
The number of currently active durables or the topic. |
|
|
|
Consumers |
The number of consumers for the topic. |
|
|
|
Durables |
The number of durables for the topic. |
|
|
|
Fail Safe |
When checked, the message is marked as failsafe delivery. |
|
|
|
Flow Control Max Bytes |
The maximum number of bytes allocated for use by flow control. |
|
|
|
Global |
When checked, the message is global and is routed to other servers. |
|
|
|
In KB/s |
The amount of inbound messages for the topic, in kilobytes per second. |
|
|
|
In KB |
The total amount of inbound messages for the topic, in kilobytes, since the server started. |
|
|
|
Max Bytes |
The maximum size, in bytes, that the topic can store for delivery to each durable or non-durable online subscriber on that topic. |
|
|
|
Max Msgs |
The maximum number of messages before the server indicates an error and overflow policies are activated. |
|
|
|
Out KB/s |
The amount of outbound messages for the topic, in kilobytes per second. |
|
|
|
Out KB |
The total amount of outbound messages for the topic, in bytes. |
|
|
|
Overflow Policy |
Indicates whether an overflow policy is set for the topic: 0 = No policy is set. 1 = A policy is set. |
|
|
|
Secure |
When checked, the topic is designated as secure and enforces permission policies. |
|
|
|
Static |
When checked, the topic has a static destination. |
|
|
|
Subscribers |
The number of subscribers for the topic. |
|
|
|
Description |
Descriptive text to help the administrator identify this resource. |
|
|
|
Current in Total Msgs |
Displays the change (delta) in inboundTotalMessages from the previous cache refresh to the current cache refresh. |
|
|
|
Current in Total Bytes |
Displays the change (delta) in inboundTotalBytes from the previous cache refresh to the current cache refresh. |
|
|
|
Current Out Total Msgs |
Displays the change (delta) in outboundTotalMessages from the previous cache refresh to the current cache refresh. |
|
|
|
Current Out Total Bytes |
Displays the change (delta) in outboundTotalBytes from the previous cache refresh to the current cache refresh. |
|
|
|
Expired |
When checked, performance data has not been received within the time specified (in seconds) in the Expire Time field in the Duration region in the RTView Configuration Application > (Project Name) > Solution Package Configuration > TIBCO Enterprise Message Service > DATA STORAGE tab. The Delete Time field (also in the Duration region) allows you to define the amount of time (in seconds) in which the row will be removed from the table if there is no response. |
|
|
|
Time Stamp |
The date and time this row of data was last updated. |
|
|
Server Name |
The name of the EMS Server selected from the EMS Server drop-down menu. |
|
|
|
Critical/Warning |
The total number of critical and warning alerts for the server. |
|
|
|
Last Update |
The date and time of the last data update. |
|
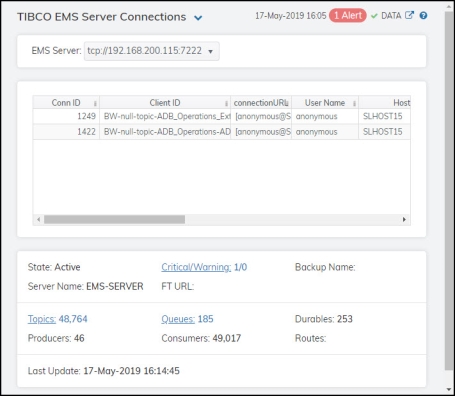
TIBCO EMS Server Connections
Clicking Connections in the left/navigation menu opens the TIBCO EMS Server Connections display, which allows you to view metrics for all connections on a single server. The table lists all of the connections and their associated metrics for the selected server. The bottom portion of the display lists additional details for the selected server. Clicking the Critical/Warning link at the bottom of the display opens the Alerts Table by Component display. Clicking the Topics link at the bottom of the display opens the TIBCO EMS Topics Table display. Clicking the Queues link at the bottom of the display opens the TIBCO EMS Queues Table display.
|
Fields and Data This display includes: |
|||
|
|
EMS Server |
The EMS Server selected from this drop-down menu populates all associated Connections data in this display. |
|
|
|
Connections Table |
This table describes the current connections on the selected server. |
|
|
|
Conn ID |
The unique numeric ID assigned to this connection that can be used for deletion. |
|
|
|
Client ID |
The unique string identifier assigned to the client. |
|
|
|
|
connectionURL |
The connection URL. |
|
|
|
User Name |
The user name. |
|
|
|
Host |
The name of the host to which the server is connected. |
|
|
|
Type |
The type of connection: Queue, Topic or System. |
|
|
|
Consumers |
The total number of consumers currently connected. |
|
|
|
Producers |
The total number of producers currently connected. |
|
|
|
Sessions |
The total number of sessions currently connected. |
|
|
|
Start Time |
The date and time the server was started |
|
|
|
Up Time |
The amount of time, in milliseconds, since the server was started. |
|
|
|
Expired |
When checked, performance data has not been received within the time specified (in seconds) in the Expire Time field in the Duration region in the RTView Configuration Application > (Project Name) > Solution Package Configuration > TIBCO Enterprise Message Service > DATA STORAGE tab. The Delete Time field (also in the Duration region) allows you to define the amount of time (in seconds) in which the row will be removed from the table if there is no response. |
|
|
|
time_stamp |
The date and time this row of data was last updated. |
|
|
State |
The server status: Active -- The server is currently processing requests. Inactive -- The server is not currently processing requests. Standby -- The server is functioning as a backup for a primary server. |
|
|
|
Critical/Warning |
The total number of critical and warning alerts for the server. |
|
|
|
Backup Name |
The name of the backup server for this server. |
|
|
|
Server Name |
The name of the EMS Server selected from the EMS Server drop-down menu. |
|
|
|
FT URL |
The IP address and port number, or the hostname and port number, of the fault tolerant standby server assigned to this server. |
|
|
|
Topics |
The number of topics currently active on the server. Click to open the TIBCO EMS Topics Table display for details. |
|
|
|
Queues |
The number of queues currently active on the server. Click to open the TIBCO EMS Queues Table display for details. |
|
|
|
Durables |
The number of durables currently active on the server. |
|
|
|
Producers |
The number of producers currently active on the server. |
|
|
|
Consumers |
The number of consumers currently active on the server. |
|
|
|
Routes |
The number of routes defined on the server. |
|
|
|
Last Update |
The date and time of the last data update. |
|
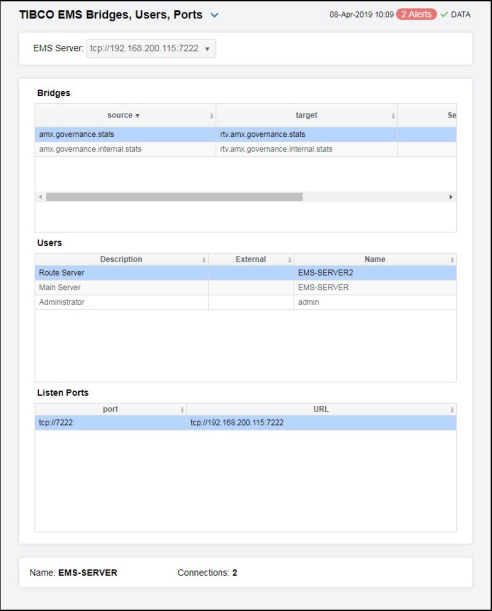
TIBCO EMS Bridges, Users, Ports
Clicking Other Server Metrics from the left/navigation menu opens the TIBCO EMS Bridges, Users, Ports display, which allows you to view bridges configured on an EMS Server, as well as their associated users and ports.
|
Fields and Data This display includes: |
|||
|
|
EMS Server |
The EMS Server selected from this drop-down menu populates all associated Bridges, Users, and Ports data in this display. |
|
|
|
Bridges |
This table describes the bridges for the selected server. |
|
|
|
|
source |
The topic or queue which is the source of the bridge. |
|
|
target |
The topic or queue which is the target of the bridge. |
|
|
|
Selector |
The message selector string or blank if none has been set. |
|
|
|
|
Source Type |
The type of the source. |
|
|
|
Target Type |
The type of the target. |
|
|
|
Expired |
When checked, performance data has not been received within the time specified (in seconds) in the Expire Time field in the Duration region in the RTView Configuration Application > (Project Name) > Solution Package Configuration > TIBCO Enterprise Message Service > DATA STORAGE tab. The Delete Time field (also in the Duration region) allows you to define the amount of time (in seconds) in which the row will be removed from the table if there is no response. |
|
|
Users |
This table describes the users on the selected server. |
|
|
|
|
Description |
Textual description of the user. |
|
|
|
External |
When checked, the user is defined in an external system. |
|
|
|
Name |
The name of the connected user. |
|
|
Listen Ports |
This table describes the connections the selected server is to listen for. |
|
|
|
port |
The IP address and port number on which the server is to listen for connections. |
|
|
|
URL |
The URL on which the server is to listen for connections. |
|
|
|
Name |
The name of the EMS Server selected from the EMS Server drop-down menu. |
|
|
|
Connections |
The number of connections on the server. |
|