TIBCO BusinessWorks 5 Overview Display
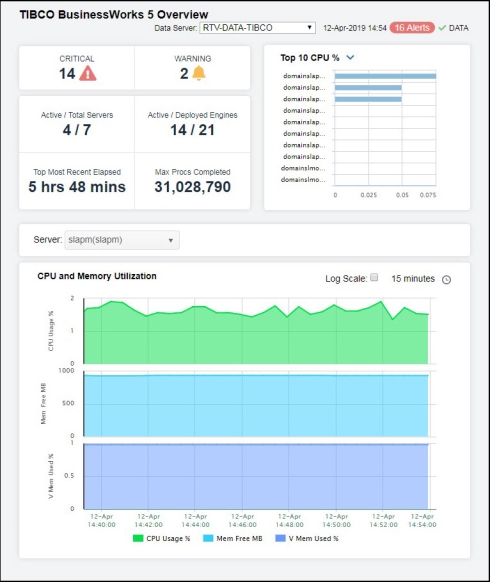
The TIBCO BusinessWorks 5 Overview is the top-level display for the TIBCO Enterprise BusinessWorks 5 Monitor, which provides a good starting point for immediately getting the status of all your servers, engines, and processes on your Data Server. You can select the RTView DataServer for which you want to see data and easily view the current data for that DataServer including:
| • | The total number of active alerts for the selected DataServer, including the total number of critical and warning alerts. |
| • | The number of active servers and the total number of servers. |
| • | The number of active and deployed engines on your connected DataServer. |
| • | The top most recent elapsed time for a process on your connected DataServer. |
| • | The maximum number of processes completed on one engine on your connected DataServer. |
| • | A visual list of the top 10 servers containing the highest CPU usage percentage/memory used percentage/completed processes/error rate per second on your connected DataServer. |
You can hover over each region in the upper half of the Overview to see more detail. You can also drill down to see even more detail by clicking on each respective region in the Overview. For example, clicking on the alerts in the CRITICAL and WARNING alerts region opens the Alerts Table by Components display.
The bottom half of the display provides a CPU and memory utilization trend graph for a selected server. You can hover over the trend graph to see the values at a particular time. You can specify the time range for the trend graph and view data based on a log scale, which enables visualization on a logarithmic scale and should be used when the range in your data is very broad.